- Chainlink price breaks above $16, paving the way for gains eyeing $18 and $20, respectively.
- Tezos follows in Chainlink’s footsteps and is likely to rally to $4 and August’s peak at $4.6.
Cryptoassets across the board have engaged thrust boosters, with many already trading at new yearly highs. Chainlink appears to be in the lead, with Tezos mirroring its price actions. The two digital assets’ technical pictures look very similar at the moment while pointing towards an eventual breakout.
Tezos and Chainlink on the cusp of a massive upswing
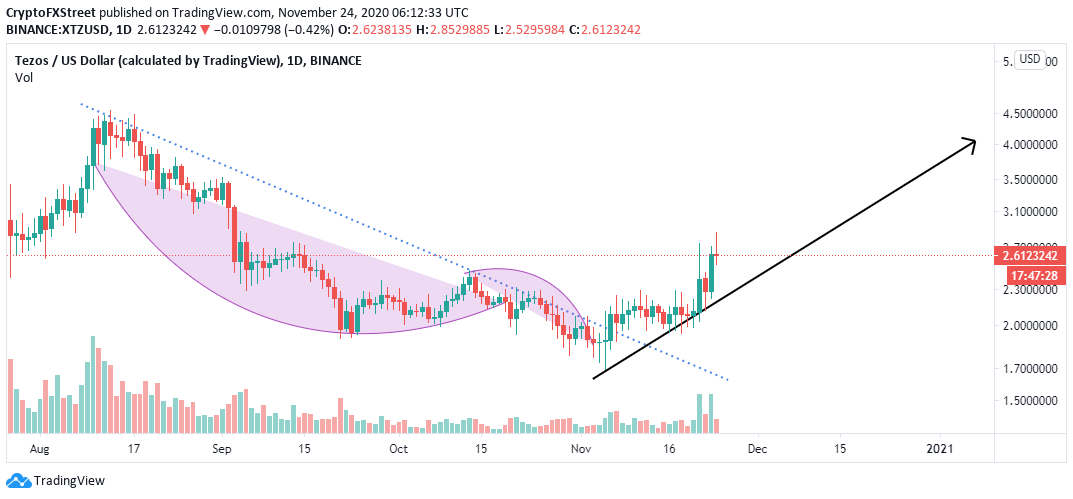
A glance at the XTZ chart illustrates a broken downtrend. The last stroke to the breakdown from August 2020 high at $4.46 occurred following the minor slump to slightly under $2.
Meanwhile, Tezos appears to have resumed the uptrend for gains eyeing $3 in the short term. If the price closes the day above the 200-day Simple Moving Average, we are likely to see a massive spike above $3 come into the picture,
 (20)-637417967921179122.png)
XTZ/USD daily chart
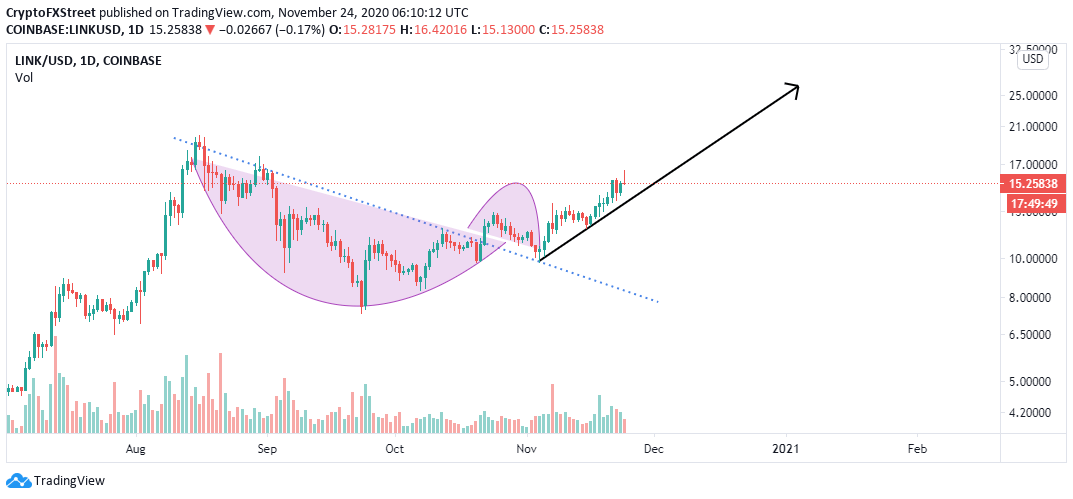
Chainlink displays a similar picture to that of Tezos; however, its price action has been drastic and in the lead. The downtrend from the 2020 high at $20 hit bottom slightly above $7, allowing buyers to regain control over the price. LINK/USD uptrend eyes $18 on the road to hitting new yearly highs.
-637417968336378360.png)
LINK/USD daily chart
For now, holding above $16 is critical to completing the final leg to $18 and $20, respectively. Besides, the Relative Strength suggests the least resistance path is upwards, especially now that it is entering the overbought region for the first time since August.
In case Tezos rises above the yearly high at $20, buyers are likely to react by increasing their positions and aiming to take advantage of the price discovery. Beyond this crucial level, the next target is $28.5.
LINK/USD daily chart
Tezos has also embarked on the journey of breaking barriers following the reversal discussed above. The next target, after the resistance at $3, is $4. If massive buy orders are triggered, XTZ could start a bull cycle to new yearly highs.
XTZ/USD daily chart
Chainlink and Tezos appear to be following the same growth pattern. Therefore, watching out for both assets side by side could provide a clear picture of where the recently started uptrends will end. For now, LINK bulls’ attention has been channeled to breaking the hurdles at $16 and $20. Tezos has focused on breaking above $3.
Information on these pages contains forward-looking statements that involve risks and uncertainties. Markets and instruments profiled on this page are for informational purposes only and should not in any way come across as a recommendation to buy or sell in these assets. You should do your own thorough research before making any investment decisions. FXStreet does not in any way guarantee that this information is free from mistakes, errors, or material misstatements. It also does not guarantee that this information is of a timely nature. Investing in Open Markets involves a great deal of risk, including the loss of all or a portion of your investment, as well as emotional distress. All risks, losses and costs associated with investing, including total loss of principal, are your responsibility. The views and opinions expressed in this article are those of the authors and do not necessarily reflect the official policy or position of FXStreet nor its advertisers. The author will not be held responsible for information that is found at the end of links posted on this page.
If not otherwise explicitly mentioned in the body of the article, at the time of writing, the author has no position in any stock mentioned in this article and no business relationship with any company mentioned. The author has not received compensation for writing this article, other than from FXStreet.
FXStreet and the author do not provide personalized recommendations. The author makes no representations as to the accuracy, completeness, or suitability of this information. FXStreet and the author will not be liable for any errors, omissions or any losses, injuries or damages arising from this information and its display or use. Errors and omissions excepted.
The author and FXStreet are not registered investment advisors and nothing in this article is intended to be investment advice.
Recommended Content
Editors’ Picks

Bitcoin Weekly Forecast: BTC nosedives below $95,000 as spot ETFs record highest daily outflow since launch
Bitcoin price continues to edge down, trading below $95,000 on Friday after declining more than 9% this week. Bitcoin US spot ETFs recorded the highest single-day outflow on Thursday since their launch in January.

Bitcoin crashes to $96,000, altcoins bleed: Top trades for sidelined buyers
Bitcoin (BTC) slipped under the $100,000 milestone and touched the $96,000 level briefly on Friday, a sharp decline that has also hit hard prices of other altcoins and particularly meme coins.

Solana Price Forecast: SOL’s technical outlook and on-chain metrics hint at a double-digit correction
Solana (SOL) price trades in red below $194 on Friday after declining more than 13% this week. The recent downturn has led to $38 million in total liquidations, with over $33 million coming from long positions.

SEC approves Hashdex and Franklin Templeton's combined Bitcoin and Ethereum crypto index ETFs
The SEC approved Hashdex's proposal for a crypto index ETF. The ETF currently features Bitcoin and Ethereum, with possible additions in the future. The agency also approved Franklin Templeton's amendment to its Cboe BZX for a crypto index ETF.

Bitcoin: 2025 outlook brightens on expectations of US pro-crypto policy
Bitcoin price has surged more than 140% in 2024, reaching the $100K milestone in early December. The rally was driven by the launch of Bitcoin Spot ETFs in January and the reduced supply following the fourth halving event in April.

Best Forex Brokers with Low Spreads
VERIFIED Low spreads are crucial for reducing trading costs. Explore top Forex brokers offering competitive spreads and high leverage. Compare options for EUR/USD, GBP/USD, USD/JPY, and Gold.