- Terra price has witnessed a 300% bull rally in under 19 days.
- Now, the buyers are facing immense selling pressure around the all-time high at $21.85.
- Momentum Reversal Indicator (MRI)’s breakout line at $22.7 will decide if LUNA will skyrocket or crash.
Terra price is experiencing a solid tug as it retests its all-time high. A crucial level stands between massive gains or a steep correction.
Terra price at an inflection point
Terra price yielded 4x returns since March 1. Now, LUNA investors could stand to profit even more if the bullish momentum manages to push through two crucial levels.
These barriers include the all-time high, coinciding with the 100% Fibonacci retracement level and the MRI’s breakout line at $22.7 on the 12-hour chart.
A spike in buying pressure leading to a breakout from these two supply barriers could see Terra price surge another 45% to 127.2% Fibonacci retracement level at $32.68.
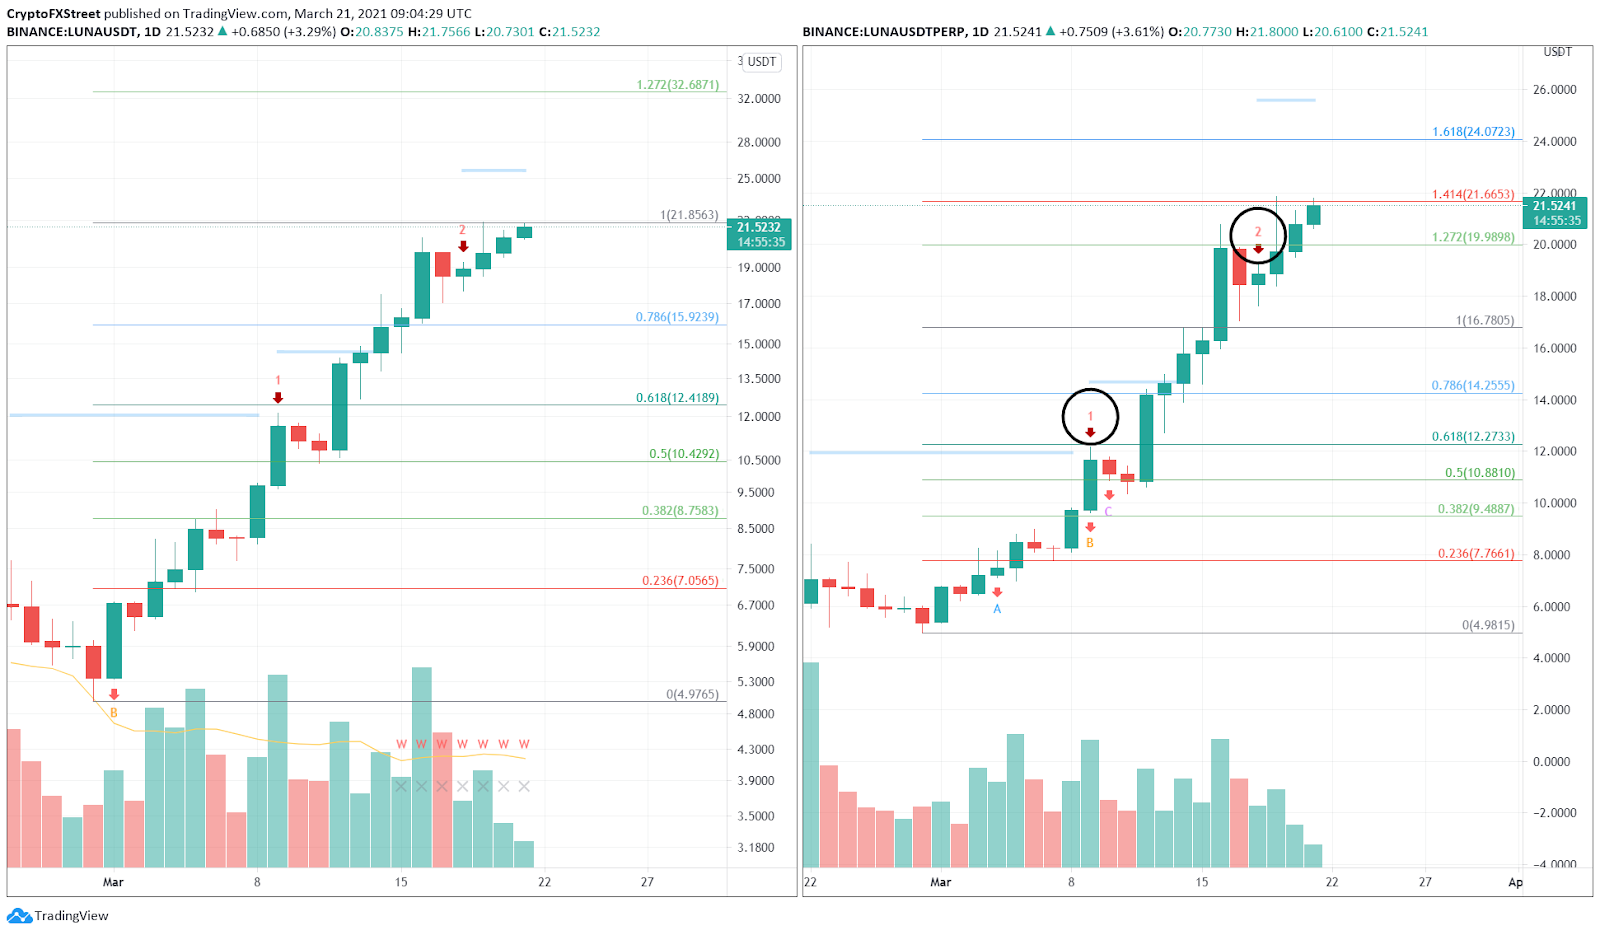
LUNA/USDT 12-hour, 1-day chart
On the other hand, investors need to note that the overall cryptocurrency market is cooling off after the massive bull run in January and February. Hence, during this phase, altcoins’ prices could move sideways or tank, if investors decide to book profits.
Adding credence to the pessimistic scenario is the MRI indicator, which shows that Terra price rally is extended as it presented a red two candlestick on the daily chart. This signal can be interpreted as the top where a reversal should have occurred.
However, due to cryptocurrencies’ volatile nature, LUNA price shot up, ignoring the technical warnings. Regardless, if the bears catch up to the bulls and validate the bearish technical indications, Terra price could experience a long-overdue correction.
In such a case, the pullback could drag LUNA down 25% to the first immediate demand barrier at $15.9, which coincides with the 78.6% Fibonacci retracement level. If the sellers manage to pierce this barrier, then the $12.4 level could be the bears’ last stop.
Information on these pages contains forward-looking statements that involve risks and uncertainties. Markets and instruments profiled on this page are for informational purposes only and should not in any way come across as a recommendation to buy or sell in these assets. You should do your own thorough research before making any investment decisions. FXStreet does not in any way guarantee that this information is free from mistakes, errors, or material misstatements. It also does not guarantee that this information is of a timely nature. Investing in Open Markets involves a great deal of risk, including the loss of all or a portion of your investment, as well as emotional distress. All risks, losses and costs associated with investing, including total loss of principal, are your responsibility. The views and opinions expressed in this article are those of the authors and do not necessarily reflect the official policy or position of FXStreet nor its advertisers. The author will not be held responsible for information that is found at the end of links posted on this page.
If not otherwise explicitly mentioned in the body of the article, at the time of writing, the author has no position in any stock mentioned in this article and no business relationship with any company mentioned. The author has not received compensation for writing this article, other than from FXStreet.
FXStreet and the author do not provide personalized recommendations. The author makes no representations as to the accuracy, completeness, or suitability of this information. FXStreet and the author will not be liable for any errors, omissions or any losses, injuries or damages arising from this information and its display or use. Errors and omissions excepted.
The author and FXStreet are not registered investment advisors and nothing in this article is intended to be investment advice.
Recommended Content
Editors’ Picks

Bitcoin Weekly Forecast: BTC nosedives below $95,000 as spot ETFs record highest daily outflow since launch
Bitcoin price continues to edge down, trading below $95,000 on Friday after declining more than 9% this week. Bitcoin US spot ETFs recorded the highest single-day outflow on Thursday since their launch in January.

Bitcoin crashes to $96,000, altcoins bleed: Top trades for sidelined buyers
Bitcoin (BTC) slipped under the $100,000 milestone and touched the $96,000 level briefly on Friday, a sharp decline that has also hit hard prices of other altcoins and particularly meme coins.

Solana Price Forecast: SOL’s technical outlook and on-chain metrics hint at a double-digit correction
Solana (SOL) price trades in red below $194 on Friday after declining more than 13% this week. The recent downturn has led to $38 million in total liquidations, with over $33 million coming from long positions.

SEC approves Hashdex and Franklin Templeton's combined Bitcoin and Ethereum crypto index ETFs
The SEC approved Hashdex's proposal for a crypto index ETF. The ETF currently features Bitcoin and Ethereum, with possible additions in the future. The agency also approved Franklin Templeton's amendment to its Cboe BZX for a crypto index ETF.

Bitcoin: 2025 outlook brightens on expectations of US pro-crypto policy
Bitcoin (BTC) price has surged more than 140% in 2024, reaching the $100K milestone in early December. The rally was driven by the launch of Bitcoin Spot Exchange Traded Funds (ETFs) in January and the reduced supply following the fourth halving event in April.

Best Forex Brokers with Low Spreads
VERIFIED Low spreads are crucial for reducing trading costs. Explore top Forex brokers offering competitive spreads and high leverage. Compare options for EUR/USD, GBP/USD, USD/JPY, and Gold.