Terra Classic Price Prediction: Uptrend Exhaustion Written on LUNC


  • Terra Classic is up 4% on the day after losing 10% the day prior.
  • LUNC could fall by 17% based on technical factors.
  • A breach of the $0.00019621 swing high would invalidate the bearish thesis.

Terra Classic continues to show signs of a market reversal. Traders should be on the lookout for a potential 10% to 18% dip in the coming days.

Terra Classic price points south

Terra Classic price is showing exhausted uptrend behavior as the digital currency is consolidating in the $0.0001700 zone. The congestion has been occurring for more than three weeks and is likely to resolve in a volatile thrust in either direction. Furthermore, there are subtle cues in the technicals that suggest the direction will be south.

Terra Classic price currently auctions at $0.0001714 as the bulls have retaliated by 4% following yesterday's 10% liquidation. Despite the retaliation , the bulls remain suppressed beneath the 8-day exponential and 21-day simple moving averages. The indicators produced a bearish cross the day prior, which catalyzed the 10% drop. The retest and failure to hurdle the crossed indicators is a classic sell signal.

Additionally, the Relative Strength Index (RSI), an indicator used to gauge trend momentum by assessing previous swing points, shows Terra Classic in a peculiar situation. For instance, unlike most cryptocurrencies, such as Bitcoin and Ethereum, the LUNC price never broke out into over-bought territory during January’s rally. Its repression under the 65 level on the RSI suggests it is a part of a counter-trend correction as opposed to the start of a new impulsive rally.

Secondly, the RSI also shows a hidden bullish signal upon the recent low. Traders looking at this indicator may be able to grab a bit more profit but should understand the risk involved. If the overall structure is corrective, there is potential for a liquidation event targeting January's low at $0.00014098. The bearish scenario creates potential for an 18% decline from the current Terra Classic market value.

tm/lunc/1/31/22

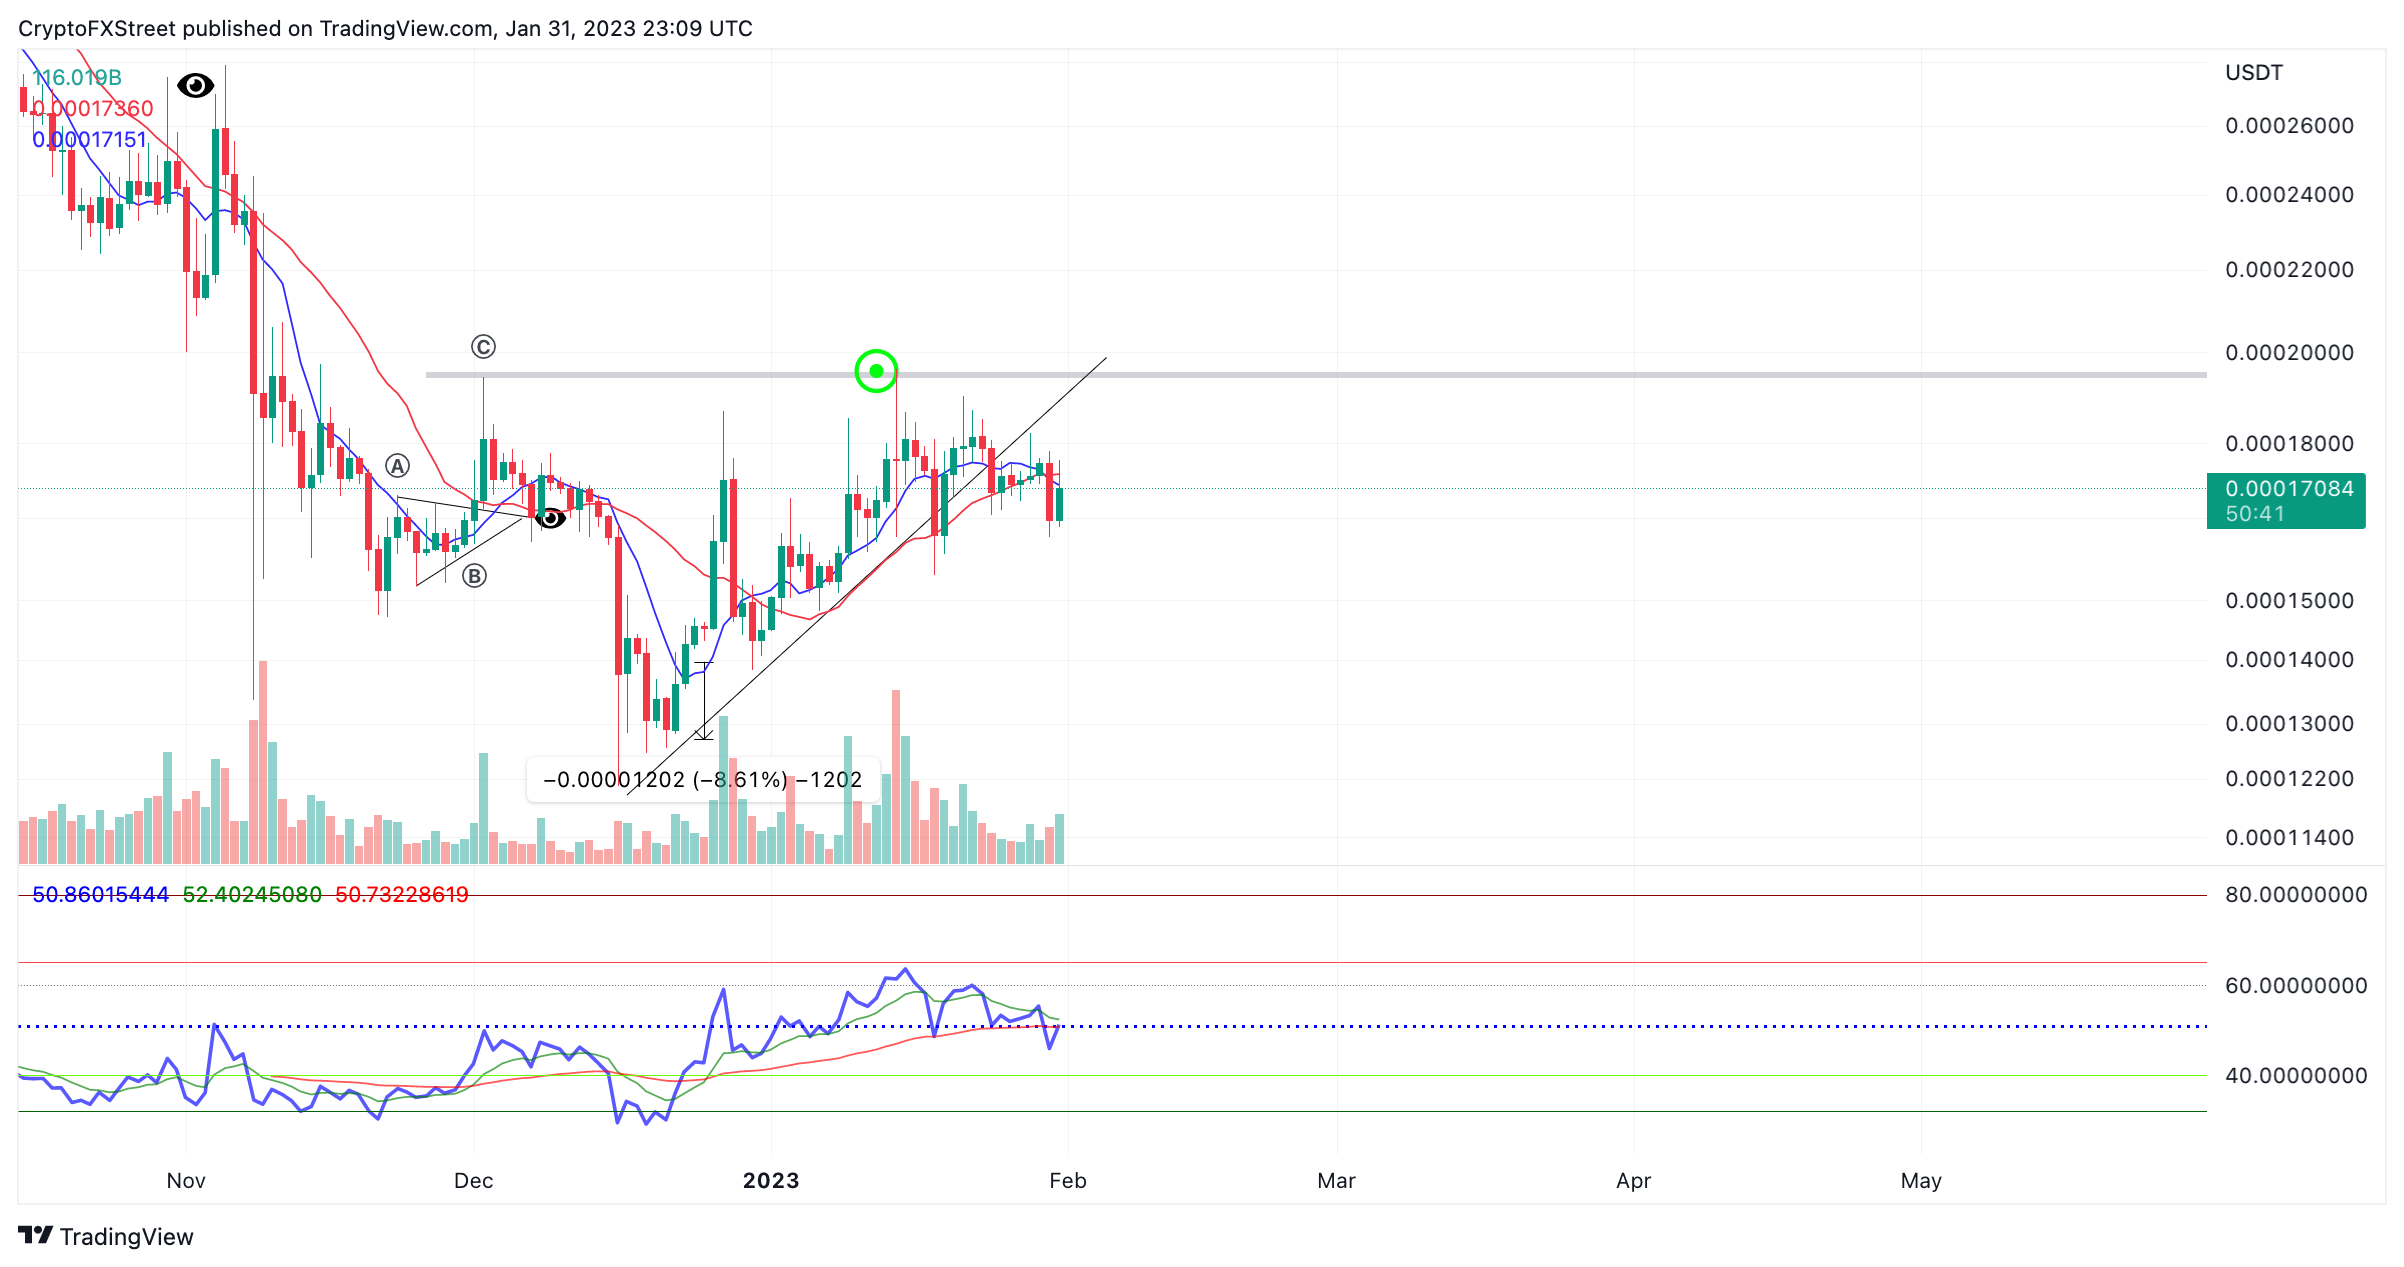
LUNC/USDT 1-day chart 

The invalidation of the downtrend idea remains the January swing high marked at $0.000019621. A breach of the barrier couldn't do a rally toward the $0.00020882 liquidity level. The bullish scenario would create a 16% increase from the current Luna Classic price.


Information on these pages contains forward-looking statements that involve risks and uncertainties. Markets and instruments profiled on this page are for informational purposes only and should not in any way come across as a recommendation to buy or sell in these assets. You should do your own thorough research before making any investment decisions. FXStreet does not in any way guarantee that this information is free from mistakes, errors, or material misstatements. It also does not guarantee that this information is of a timely nature. Investing in Open Markets involves a great deal of risk, including the loss of all or a portion of your investment, as well as emotional distress. All risks, losses and costs associated with investing, including total loss of principal, are your responsibility. The views and opinions expressed in this article are those of the authors and do not necessarily reflect the official policy or position of FXStreet nor its advertisers. The author will not be held responsible for information that is found at the end of links posted on this page.

If not otherwise explicitly mentioned in the body of the article, at the time of writing, the author has no position in any stock mentioned in this article and no business relationship with any company mentioned. The author has not received compensation for writing this article, other than from FXStreet.

FXStreet and the author do not provide personalized recommendations. The author makes no representations as to the accuracy, completeness, or suitability of this information. FXStreet and the author will not be liable for any errors, omissions or any losses, injuries or damages arising from this information and its display or use. Errors and omissions excepted.

The author and FXStreet are not registered investment advisors and nothing in this article is intended to be investment advice.

Join Telegram

Recommended content


Recommended Content

Editors’ Picks

Ripple on-chain metrics show bullish signs amidst legal struggle with SEC, XRP eyes recovery

Ripple on-chain metrics show bullish signs amidst legal struggle with SEC, XRP eyes recovery

Ripple made a comeback above $0.48 on Tuesday and hovers above that level in Wednesday’s European session. Ripple on-chain metrics such as transaction volume and Network Realized Profit/Loss have turned bullish, supporting a recovery in the altcoin. 

More Ripple News

Bitcoin price falls amidst German government transfers, miners activity

Bitcoin price falls amidst German government transfers, miners activity

Bitcoin (BTC) extends correction on Wednesday and hovers around $61,000 after finding resistance near the $64,000 level on Monday. Recent on-chain data indicates heightened selling activity from Bitcoin miners early in the week. 

More Bitcoin News

Crypto Today: Bitcoin erases gains from end of June, Ethereum declines while Ripple holds

Crypto Today: Bitcoin erases gains from end of June, Ethereum declines while Ripple holds

Bitcoin wipes out gains from the last week of June and falls below $60,000 on Wednesday. Ethereum and top altcoins ranked by market capitalization erased gains as the inflation outlook worsened. Ripple holds on to recent gains and hovers above $0.48 on Wednesday. 

More Cryptocurrencies News

Three reasons why altcoins could shake off losses this week

Three reasons why altcoins could shake off losses this week

On-chain data from Santiment shows that altcoins are currently in the opportunity zone, or generating buy signals. The top three altcoins in the buy zone are Basic Attention Token (BAT), Chromia (CHR), and Highstreet (HIGH), per Santiment. 

More Altcoins News

Bitcoin: BTC price correction could end in July, according to seasonal data

Bitcoin: BTC price correction could end in July, according to seasonal data

Bitcoin (BTC) price appears poised for a decline this week, influenced by slight outflows in US spot ETFs, selling activity among BTC miners, and a combined transfer of 4,690.28 BTC to centralized exchanges by the US and German governments.

Read full analysis

BTC

ETH

XRP