• Terra’s Luna Classic price is up by over 12% after brushing shoulders with $0.000280.
  • LUNC’s immediate support at $0.000250 is essential for the next move that could see it top $0.000300.
  • Resistance at the 200-day SMA could invalidate the bullish outlook in Luna Classic price.

Terra’s Luna Classic price continues with the week-long winning streak that has seen it lift from support at $0.000210. Its bullish momentum gained traction with a subsequent break above $0.000230. Trading above a crucial month-long falling trend line propelled Luna Classic to $0.000280 before returning to trade at $0.000252 on Saturday.

Assessing the bullish potential in Terra Classic price

Odds flipped to favor a bullish move in LUNC’s price as soon as a buy signal from the Moving Average Convergence Divergence (MACD) came into play. The call to buy LUNC coincided with a rebound from its primary support at $0.00021.

Investor confidence in the trend reversal was later bolstered by Terra Classic price spike above a confluence resistance around $0.000242 – created by the 100-day Exponential Moving Average (EMA) (in blue) and the falling trend line (in black).

LUNCUSDT four-hour chart

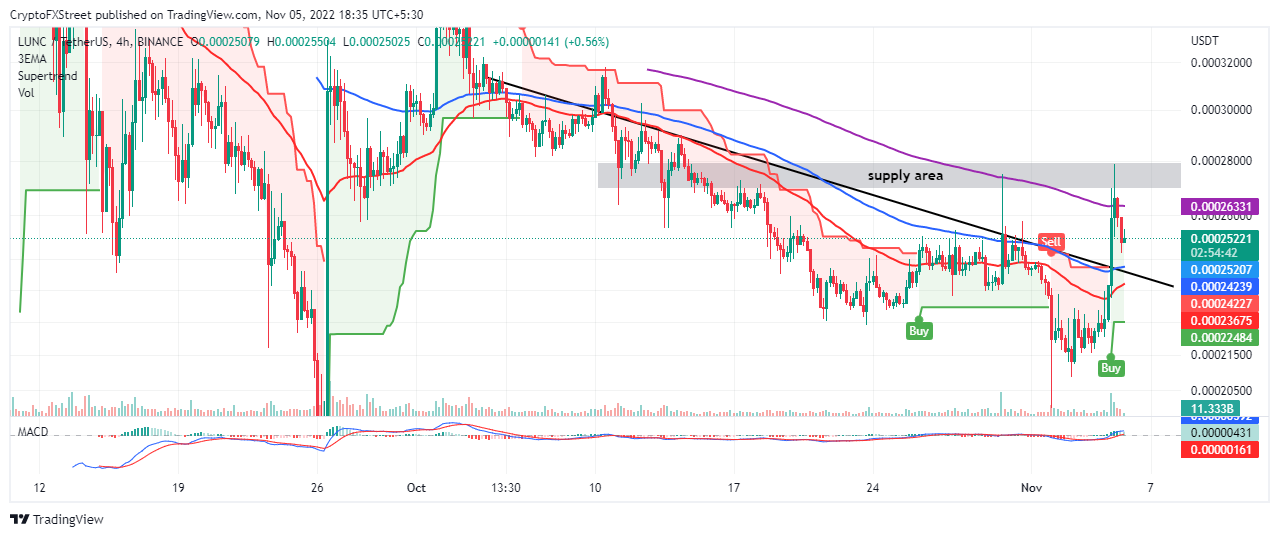
LUNC/USD four-hour chart

Traders looking for long positions in LUNC price can still do so as long as the Moving Average Convergence Divergence (MACD) upholds its optimistic outlook. With the MACD holding above the mean line, Terra’s Luna Classic could quickly regain momentum for gains above $0.000280.

The four-hour chart brings to light another buy signal, presented by the SuperTrend indicator. This technical index overlays the chart like a moving average, but it uses the average true range (ATR) to gauge market volatility.

A buy signal manifests with the Super Trend flipping below LUNC, as shown on the chart. Terra Classic price is expected to remain in an uptrend direction until the Super Trend moves above the price and sends a sell signal.

Traders should proceed cautiously because support at $0.000250 may bow to the building overhead pressure from resistance at the 200-day EMA (in purple) and LUNC’s weekly high at $0.000280.

A four-hour to a daily close below $0.000250 could validate profitable short positions, with possible exit points at the 100-day EMA and the 50-day EMA.

On the bright side, the odds still favor the bulls, and Terra Classic price may only need to break above $0.000280 to clear the path above $0.000300.


Information on these pages contains forward-looking statements that involve risks and uncertainties. Markets and instruments profiled on this page are for informational purposes only and should not in any way come across as a recommendation to buy or sell in these assets. You should do your own thorough research before making any investment decisions. FXStreet does not in any way guarantee that this information is free from mistakes, errors, or material misstatements. It also does not guarantee that this information is of a timely nature. Investing in Open Markets involves a great deal of risk, including the loss of all or a portion of your investment, as well as emotional distress. All risks, losses and costs associated with investing, including total loss of principal, are your responsibility. The views and opinions expressed in this article are those of the authors and do not necessarily reflect the official policy or position of FXStreet nor its advertisers. The author will not be held responsible for information that is found at the end of links posted on this page.

If not otherwise explicitly mentioned in the body of the article, at the time of writing, the author has no position in any stock mentioned in this article and no business relationship with any company mentioned. The author has not received compensation for writing this article, other than from FXStreet.

FXStreet and the author do not provide personalized recommendations. The author makes no representations as to the accuracy, completeness, or suitability of this information. FXStreet and the author will not be liable for any errors, omissions or any losses, injuries or damages arising from this information and its display or use. Errors and omissions excepted.

The author and FXStreet are not registered investment advisors and nothing in this article is intended to be investment advice.

Join Telegram

Recommended content


Recommended Content

Editors’ Picks

Ripple on-chain metrics show bullish signs amidst legal struggle with SEC, XRP eyes recovery

Ripple on-chain metrics show bullish signs amidst legal struggle with SEC, XRP eyes recovery

Ripple made a comeback above $0.48 on Tuesday and hovers above that level in Wednesday’s European session. Ripple on-chain metrics such as transaction volume and Network Realized Profit/Loss have turned bullish, supporting a recovery in the altcoin. 

More Ripple News

Bitcoin price falls amidst German government transfers, miners activity

Bitcoin price falls amidst German government transfers, miners activity

Bitcoin (BTC) extends correction on Wednesday and hovers around $61,000 after finding resistance near the $64,000 level on Monday. Recent on-chain data indicates heightened selling activity from Bitcoin miners early in the week. 

More Bitcoin News

Crypto Today: Bitcoin erases gains from end of June, Ethereum declines while Ripple holds

Crypto Today: Bitcoin erases gains from end of June, Ethereum declines while Ripple holds

Bitcoin wipes out gains from the last week of June and falls below $60,000 on Wednesday. Ethereum and top altcoins ranked by market capitalization erased gains as the inflation outlook worsened. Ripple holds on to recent gains and hovers above $0.48 on Wednesday. 

More Cryptocurrencies News

Three reasons why altcoins could shake off losses this week

Three reasons why altcoins could shake off losses this week

On-chain data from Santiment shows that altcoins are currently in the opportunity zone, or generating buy signals. The top three altcoins in the buy zone are Basic Attention Token (BAT), Chromia (CHR), and Highstreet (HIGH), per Santiment. 

More Altcoins News

Bitcoin: BTC price correction could end in July, according to seasonal data

Bitcoin: BTC price correction could end in July, according to seasonal data

Bitcoin (BTC) price appears poised for a decline this week, influenced by slight outflows in US spot ETFs, selling activity among BTC miners, and a combined transfer of 4,690.28 BTC to centralized exchanges by the US and German governments.

Read full analysis

BTC

ETH

XRP