Terra Classic price cannot withstand pressure of bulls slowly making their way toward exit
- Terra Classic sees an orderly outflow as bearish pressure mounts.
- LUNC sees its price action becoming disorderly with price gaps and illiquid zones as cash gets pulled.
- Expect to see a lower leg in search of support before supply and demand balance are restored.

Terra Classic (LUNC) is starting to behave as an illiquid currency as the charting shows for November that more price jumps, gaps and breaks occur between the close from the previous day against the opening on the next day. This points to a distorted market where supply and demand are not in equilibrium, and bulls and bears are too far from each other when agreeing on the price of LUNC. Expect to see a further leg lower to create more buy-side demand, which can correct this dislocation and create more normal behavior, as seen in September and October of this year.
LUNC needs to get itself fixed first
Terra Classic price action is the result of what has happened over the past two weeks in cryptocurrencies. With traders turning their back yet again away from the asset class, only the majors are trying to keep their heads above water. While the more alt-currencies are showing very choppy price action and reaction on the charts. Since the beginning of last week, LUNC has been jumping all over the place, with several price gaps, distorted openings and closes intraday as traders try their best to trade the impossible.
LUNC thus first needs to find calm waters, which can only be at the lower end of its pricing ladder. The high of May 30 at $0.00017220 could do that trick. When traders touch base there, at least two or three more normal trading days occurred on the back of that event. Expect to see a return to that level, with possibly the monthly S2 coming in at $0.0000144398 as a failsafe system should price action slide lower. This would next trigger a bounce higher for next week.
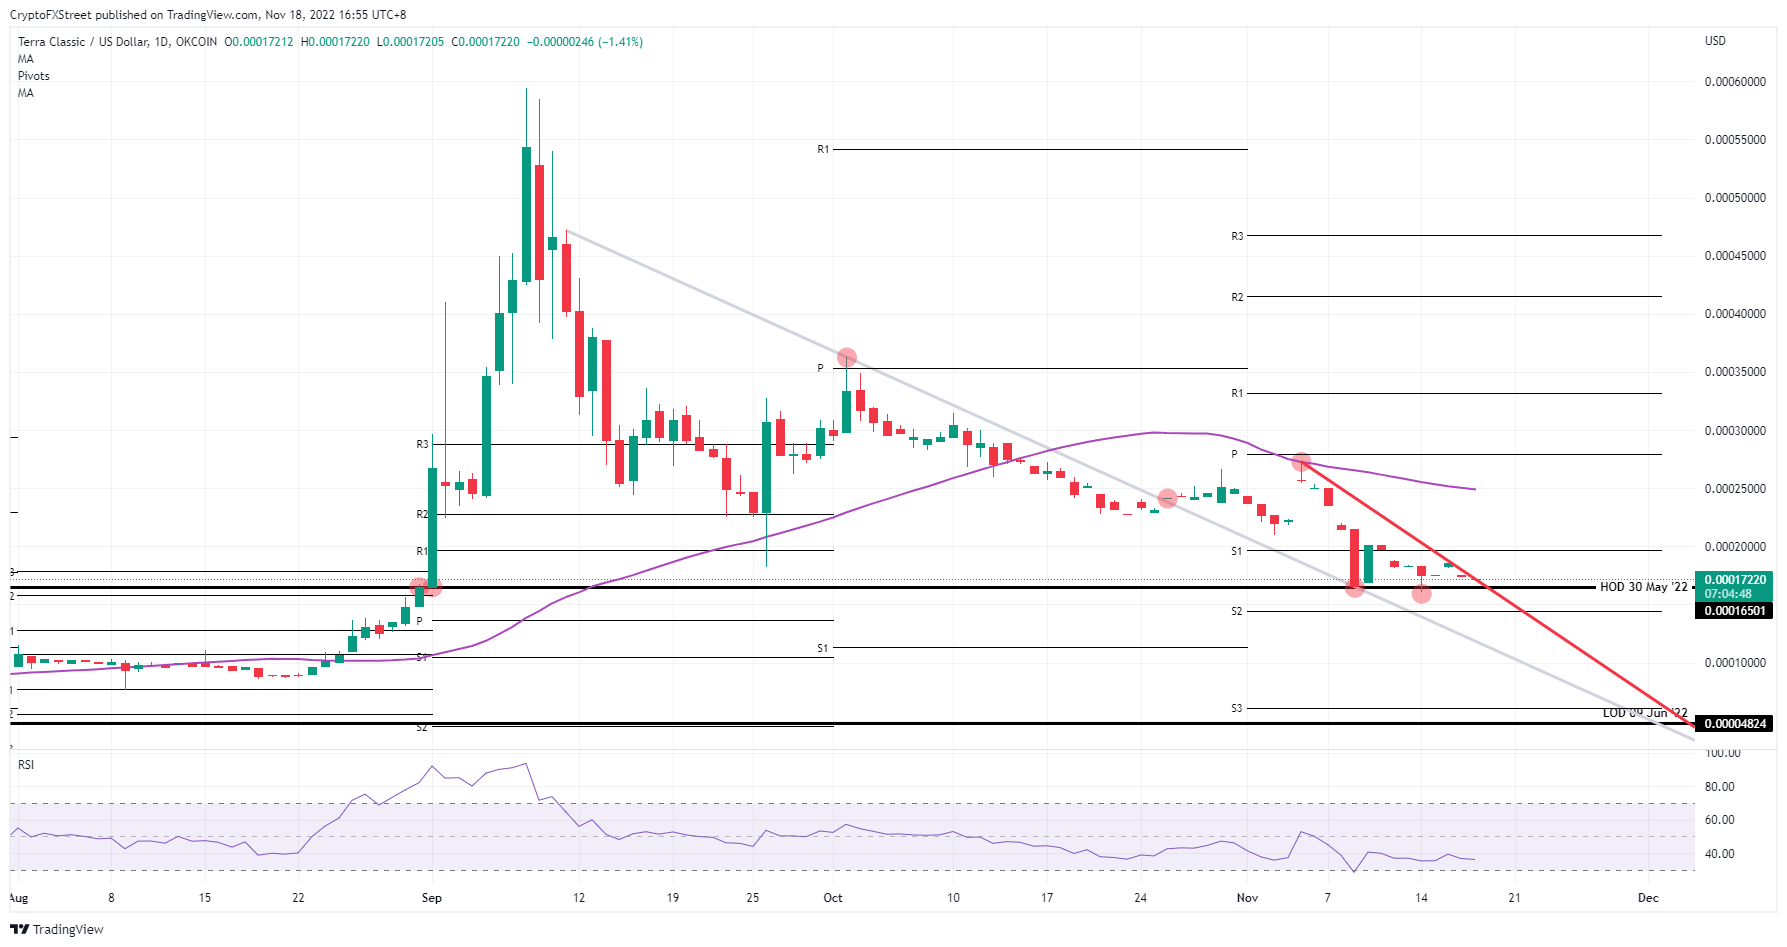
LUNC/USD daily chart
A simple squeeze could also do the trick, should a bullish catalyst emerge on Friday with some positive headlines on geopolitics or US equities rallying into the weekend. Bulls would blow out the demand side volume with too much buying pressure and insufficient supply. This might trigger a spiral increase in the price. LUNC could be seen breaking out of the red descending trend line and testing the monthly S1 at $0.00020000 before targeting $0.00025000 going into next week.
Author

Filip Lagaart
FXStreet
Filip Lagaart is a former sales/trader with over 15 years of financial markets expertise under its belt.


