Technical weekly: Halving is done, what’s next?
Key takeaways
The cryptocurrency markets were relatively calm after the third BTC halving took place in Asia overnight.
Traders and investors focus on the development of the hash rate as some analysts believe it could drop as much as 30% in post-halving.
Technical indicators showed that major altcoins still not out of the woods yet.
Market overview
The cryptocurrency markets were a mixed bag on Tuesday Asia after the bitcoin halving event took place overnight. The price of BTC has been range-bounding between USD 8500 to just below 9000 in the early Asia session.At the same time, markets have seen ADA jumped more than 9%, and BSV gained about 4%. On the flip side, XEM and DGB gave up about 6% of the value.
As the prices of BTC seem to struggle to reclaim the USD 9000 levels, markets could expect to see more short position closings in the coming days. Thomas Tse, Head Quantitative Strategist at OKEx, noted that traders might want to unwind their previous short positions within the first three days after the halving took place.
On-chain data would be another focus in the post-halving market. Data from blockchain.com shows that bitcoin’s hash rate was near the all-time high when the halving event occurred. Investors may want to find out whether this hash rate uptrend is sustainable because this could reveal miners’ sentiment on the price and how they view the markets.
Molly, Head of Marketing at Hash Key hub, twitted that BTC’s hash power could drop as much as 30% in the coming few days, as the mining earnings dropped. Read more about what data market participants should focus on in the post-halving period here.
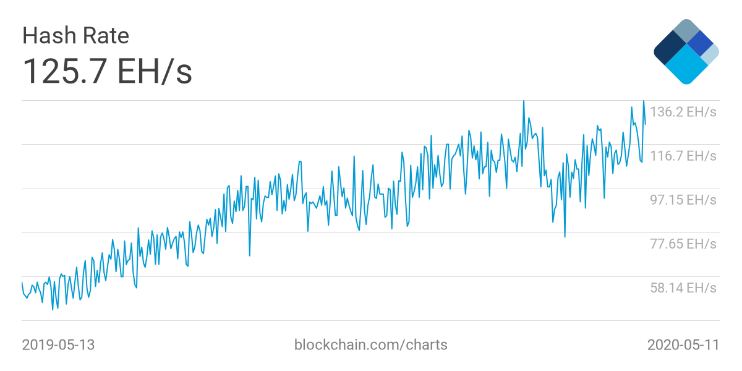
Figure 1: Bitcoin Hash Rate (as of May 12) (Source: Blockchain.com)
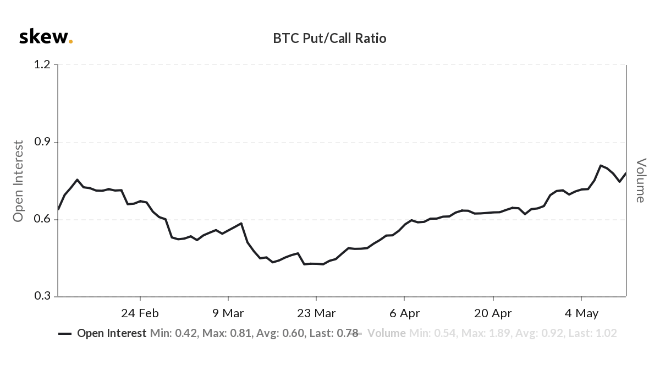
Figure 2: BTC Put/Call Ratio (Source: Skew)
Traders may also want to keep a close eye on the BTC put/call ratio, which justcame off from the recent peak. In our previous publication <Options Markets Show Less Enthusiasm on BTC Halving>, our team pointed out that a higher ratio could indicate options traders have been more bearish on the price.If a turn of the ratio is confirmed, that could suggest a significant shift of sentiment could be taking place among options traders.
Elsewhere, we may see some event-driven price actions in the altcoin space. Markets will see ETC, ATOM, and XLM will hold major events this week. THE TA watchers will probably focus on the launch of Main net 2.0, which is expected to happen later this month.
Price Analysis
BTC/USD – Glass half empty half full
BTCUSD retreated to the mid-8000 handles after failing to reclaim the June resistance levels. While the price has shown initial support at the USD 8000 area, we cannot entirely rule out the possibility of going below 8000.
Momentum could be the elephant in the room here. The MACD just produced a daily bearish crossover, signaling the positive momentum has been slowing down.
The MOM indicator retreated to the previous support levels. If a further breach is seen from here, it could strengthen the short-term BTC bearish case.
However, a price rebound from here could also be possible. Figure 4 shows the daily chart of the CME futures, which produced a gap down from 9820 to 9275.Our readers should probably know that the CME futures chart tends to close the gaps that it produced, although the timing could be hard to determine. In other words, gap-filling activities could send the price back to the upper 9000 handles.
8400 could be the first level to watch for the bears. If seen, that could increase the possibility of testing the 38.2% Fibonacci retracement near 7900. For the bulls, the high of May 11 at 9160 is critical. If the pair today can produce a candlestickthat has a higher upper shadow than May 11’s candlestick, it could strengthen the case of a rally.
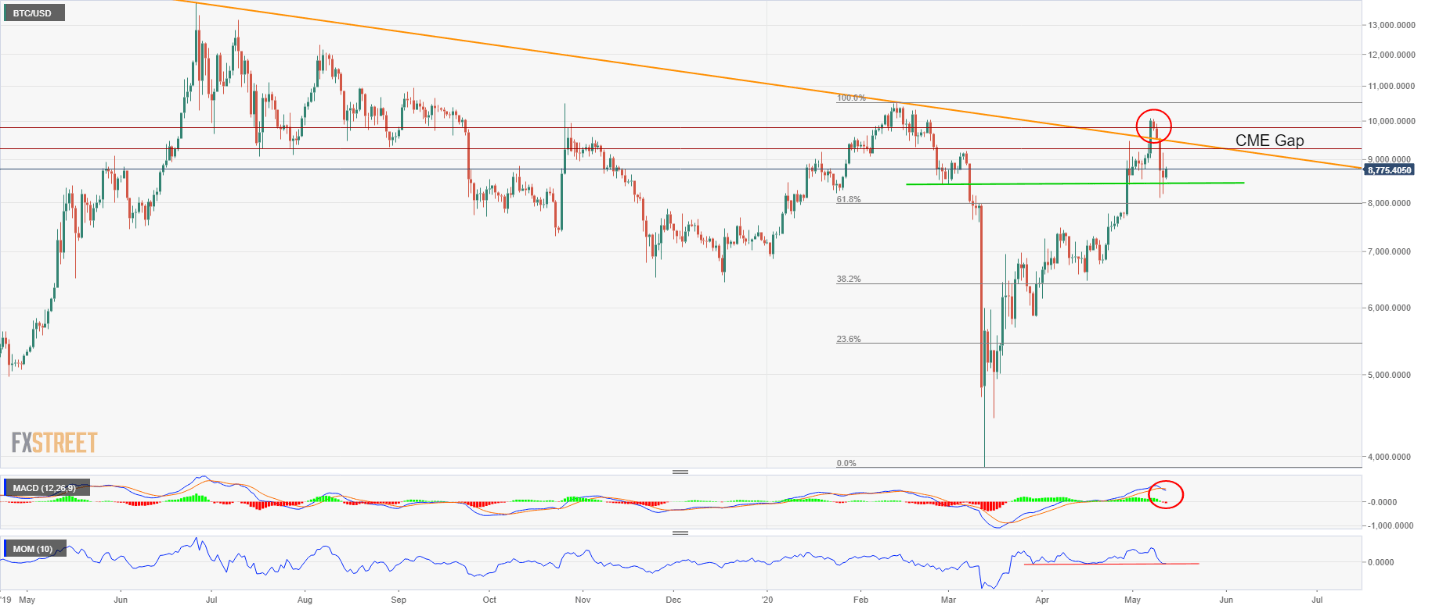
Figure 3: BTCUSD Daily Chart (Source: FX Street)
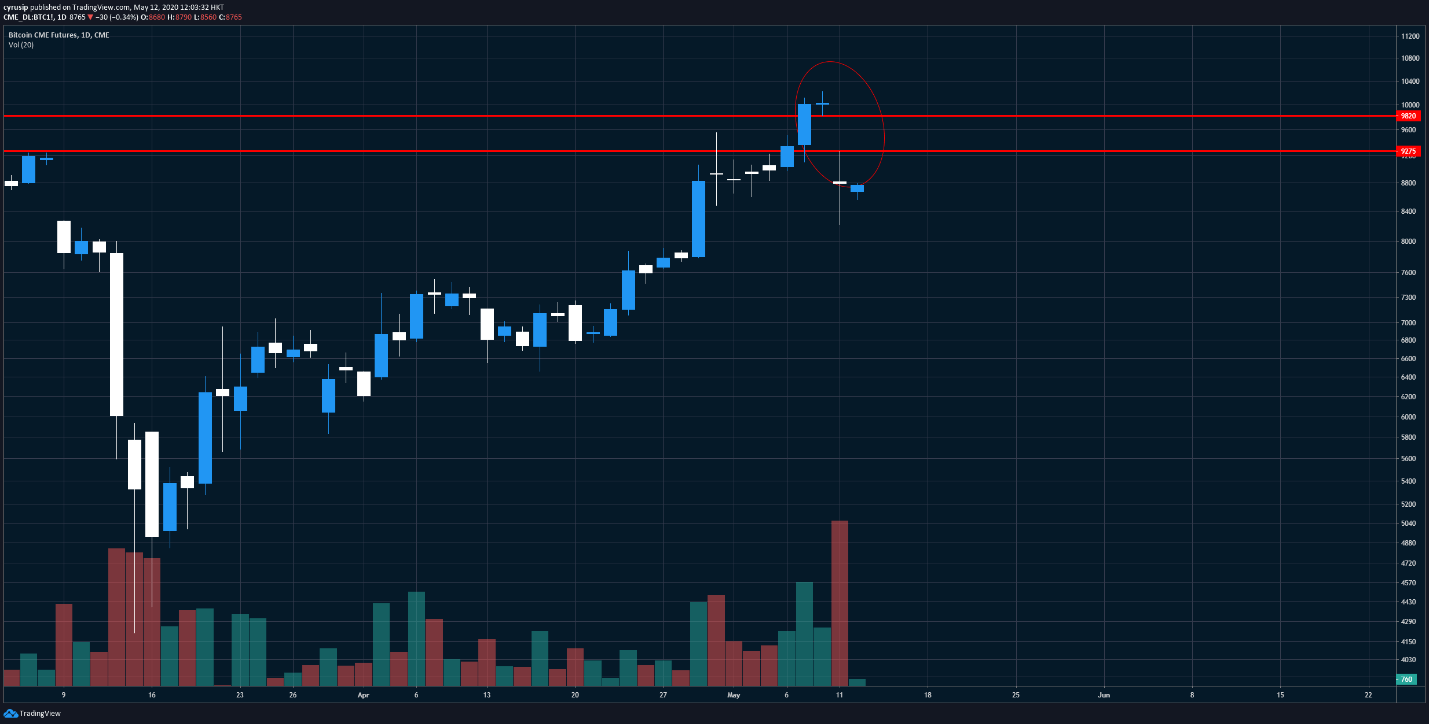
Figure 4: CME Bitcoin Futures Daily Chart (Source: CME; Tradingview)
ETH/USD – Efforts went in vain?
We’ve covered the ETHUSD weekly chart in our publication in late April and highlighted the pair has been testing one of its multi year resistances. The pair has failed to reclaim such resistance levels (figure 5).
The pair may still face another test of the daily trendline support (figure 6), which is near the 180 levels.
The MACD has widened in the negative area, and the RSI has already at a relatively low level. Still, it seems that the pair is not oversold yet. Therefore, we believe there could still be some roomfor the downside.
175 to 180 would be a key area to watch. A break below this area could trigger more selloffs. While 193 could be the upper focus.
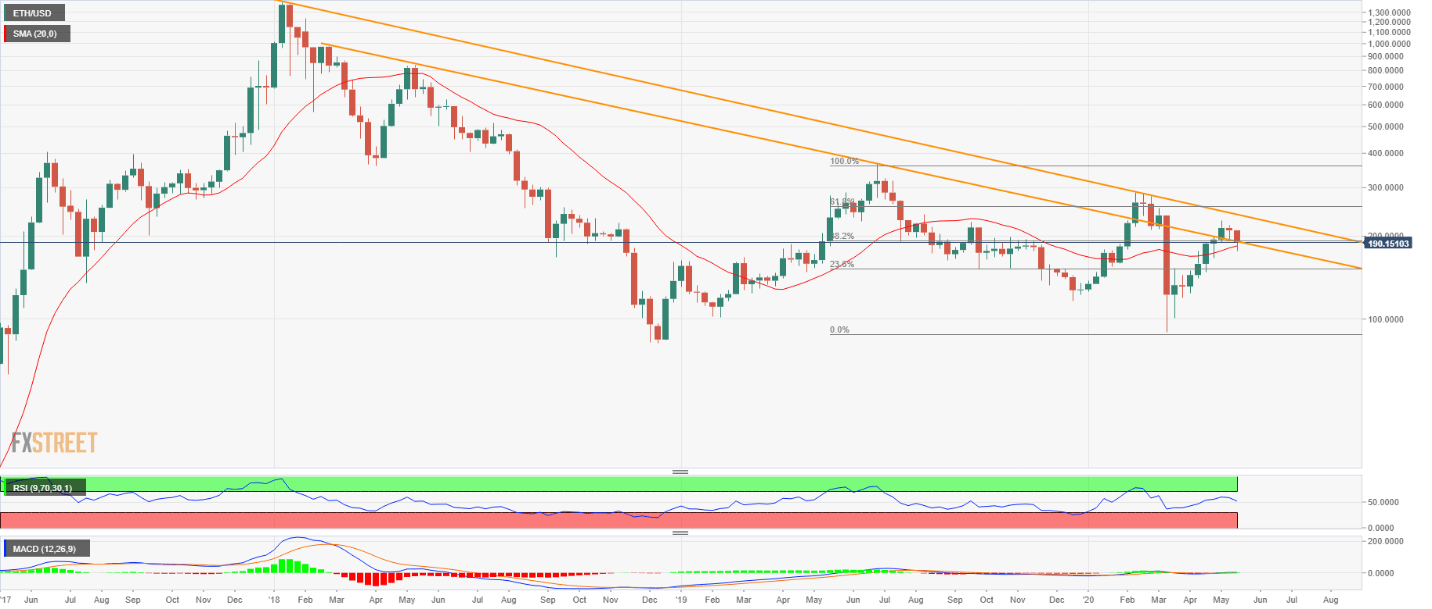
Figure 5: ETH/USD Weekly Chart (Source: FX Street)
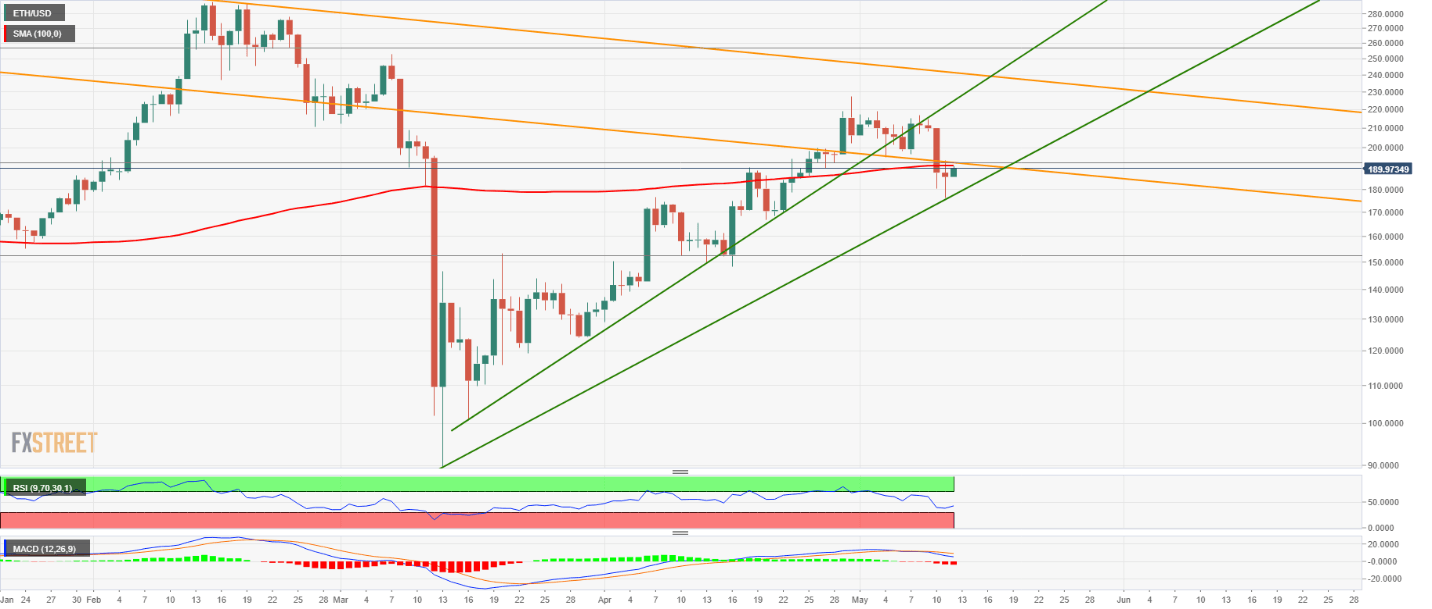
Figure 6: ETH/USD Daily Chart (Source: FX Street)
XRP/USD – More downside to come?
XRPUSDmay face more selling pressure as the price has been flipflopping around its 50-day moving average.
Momentumhas been significantly fading. The ultimate oscillator has been producing lower highs in the past two weeks, and the stochastic has broken below its previous lows.
We believe that the pair could retest the May 11 low of 0.1957. If the pair failed to find support at such levels, a pullback to 38.2% Fibonacci retracement to 0.1644 in the medium-term could become more likely.
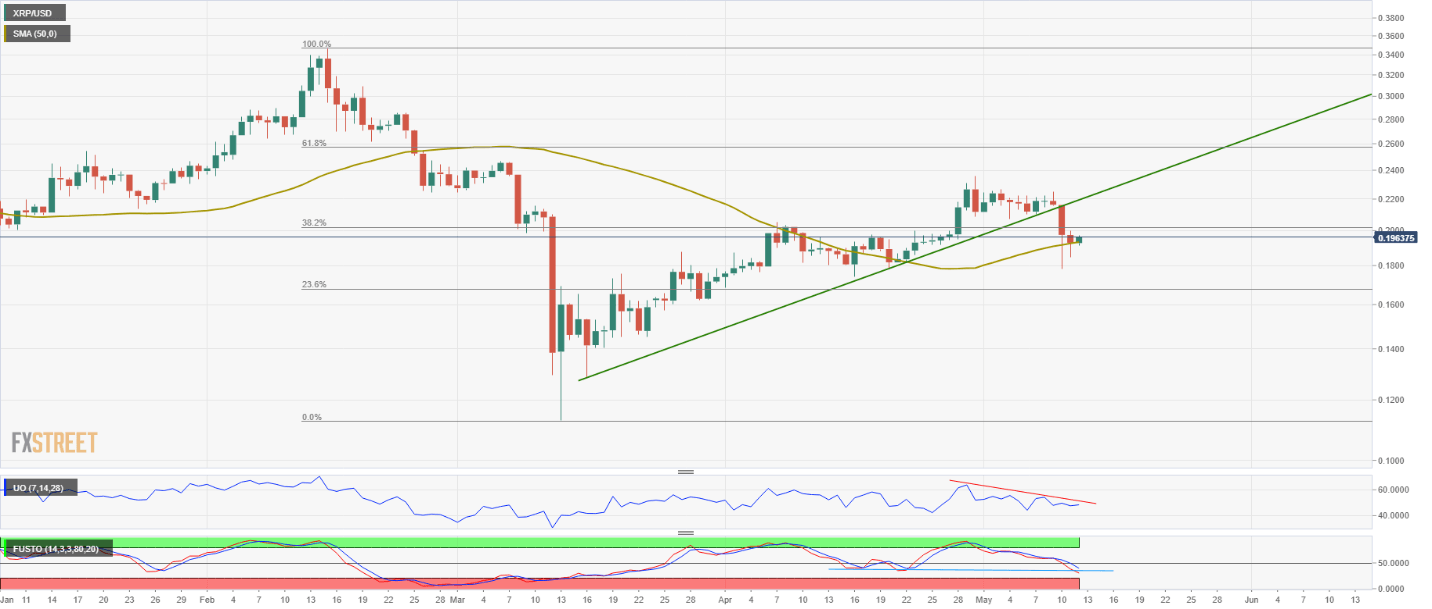
Figure 7: XRP/USD Daily Chart (Source: FX Street)
ADA/USDT – Rally runs out of steam?
ADAUSDT has been one of the top-performing alt-pairs on during the Asia session on Tuesday, gained more than 9%.
However, the bulls may look tired from here. The RSI has formed a triple bearish divergence, with three lower lows, while the price trend was still mostly maintaining near the 0.05 levels.
Additionally, the bearish crossover of the MACD has been widening, suggesting the positive momentum has been slowing down.
Level-wise, we believe the 100-SMA could be the first reference, which is near 0.043. If seen, the retest of 0.0422, which is the 61.8% Fibonacci retracement, could be more likely.
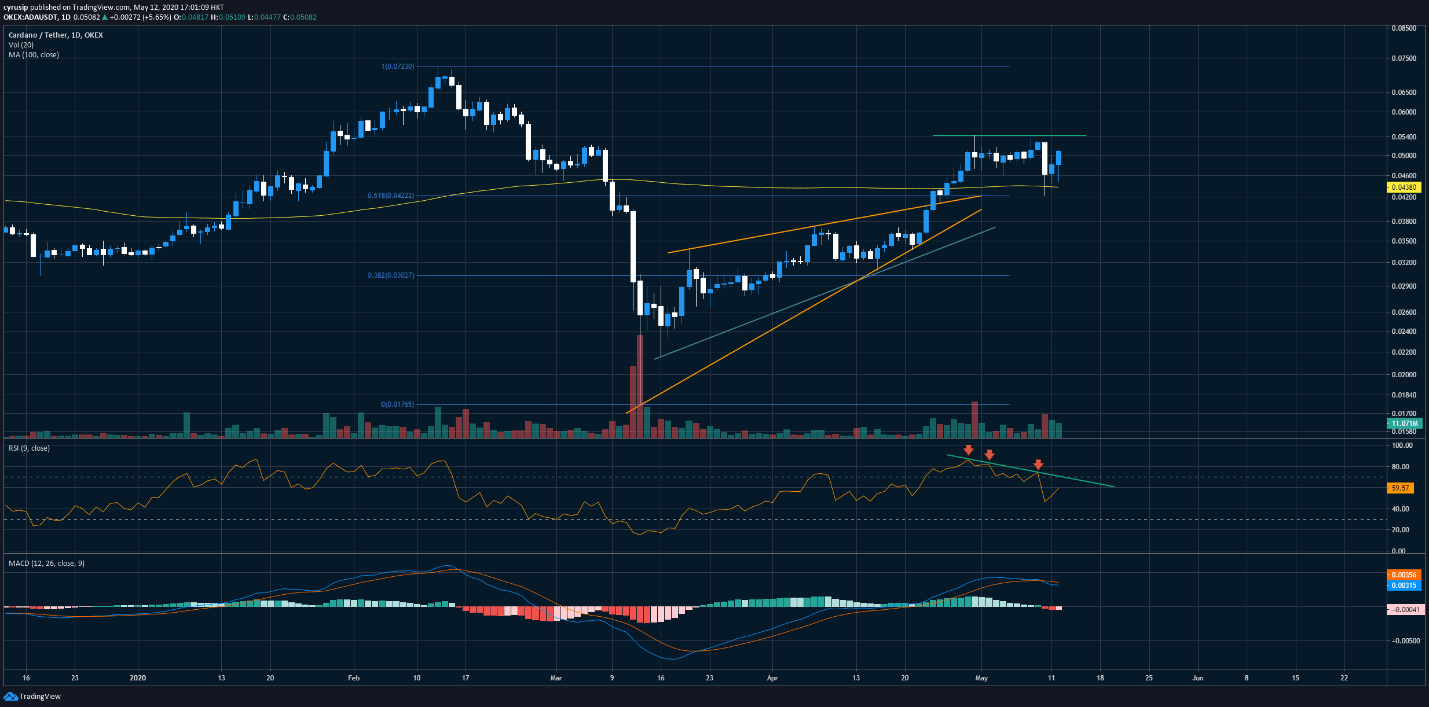
Figure 8: ADAUSDT Daily Chart (Source: OKEx; Tradingview)
Author

Cyrus Ip
OKEx
Cyrus Ip has the privilege to work with OKEx as a Research Analyst, where he found some of the brightest talents in the crypto space.


