The Altcoin market led by Ethereum faced significant selling pressure recently. Market corrections are healthy pullbacks that offer reset and dip-buying opportunities in certain circumstances.
Smart contracts are gradually becoming the 'in thing' across technological advances, with hundreds of apps that use smart contracts already up and running. However, smart contracts are currently limited as they need oracles to communicate data from the off-chain world.
This is where decentralized oracle platforms, such Band Protocol and Chainlink, come into the picture. Another platform is Zap Protocol, which allows users to create and subscribe to decentralized oracle data feeds, fueling smart contracts with real-world data. In comparison with other decentralized oracle platforms, this solution offers a way forward to incentivize data providers to create oracles through its oracle market space.
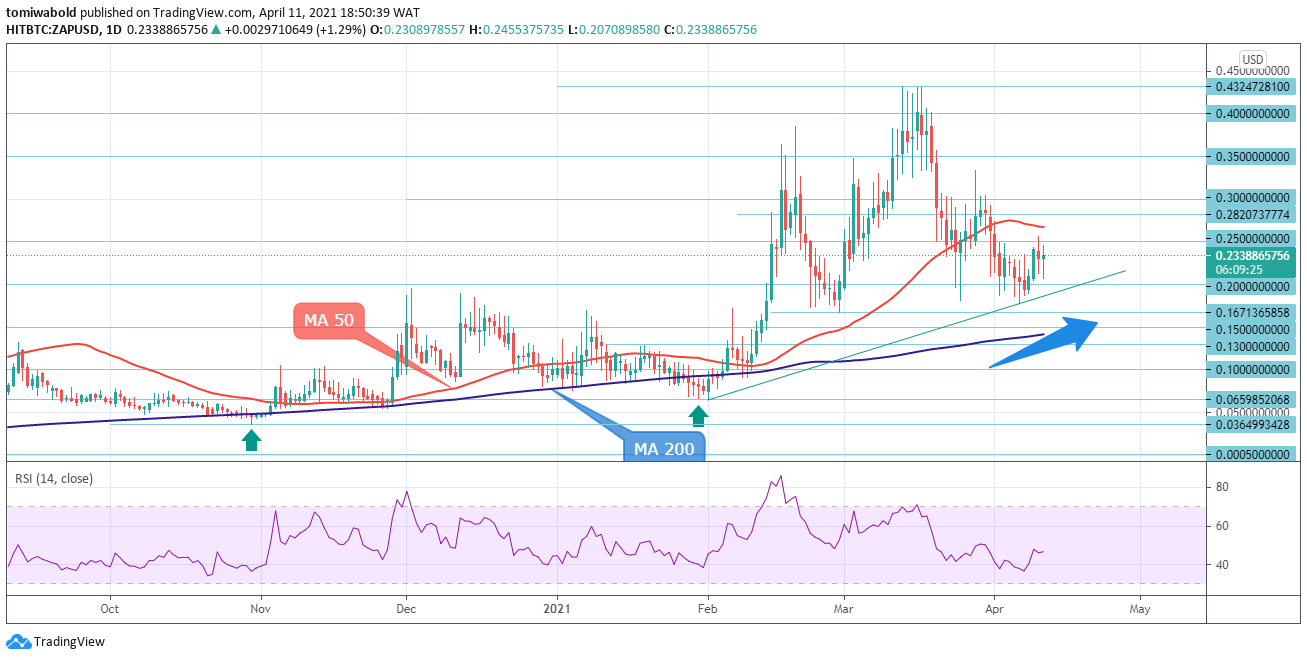
At present, ZAP demonstrates a strong buy the dip potential as its price is set to skyrocket in the coming days, also following the fact that whales are coming off an oversold position.
ZAP technical analysis: Bullish reversal spotted via Head and Shoulders pattern
After its rebound at the ascending trendline connecting the Feb. 1 low of $0.0659 and the Apr. 6 low of $0.1779, the ZAP/USD is heading sideways. This may signal the end of the bearish price swing that began on March 13 at $0.4324 and ended at $0.1779 recently. The bearish correction stayed within the shallow retracement levels, which is characteristic of a bullish trend that is still going strong.
A break above the $0.25 pivot zone is likely, and a daily close above this level would suggest that the recovery will continue. The crucial $0.30 level is expected to be flipped from resistance to support as the recovery progresses. The daily relative strength index is turning from the oversold zone, indicating that price action is returning to a bullish trend.
Supply Levels: $0.3500, $0.3000, $0.2500
Demand Levels: $0.1500, $0.1300, $0.1000
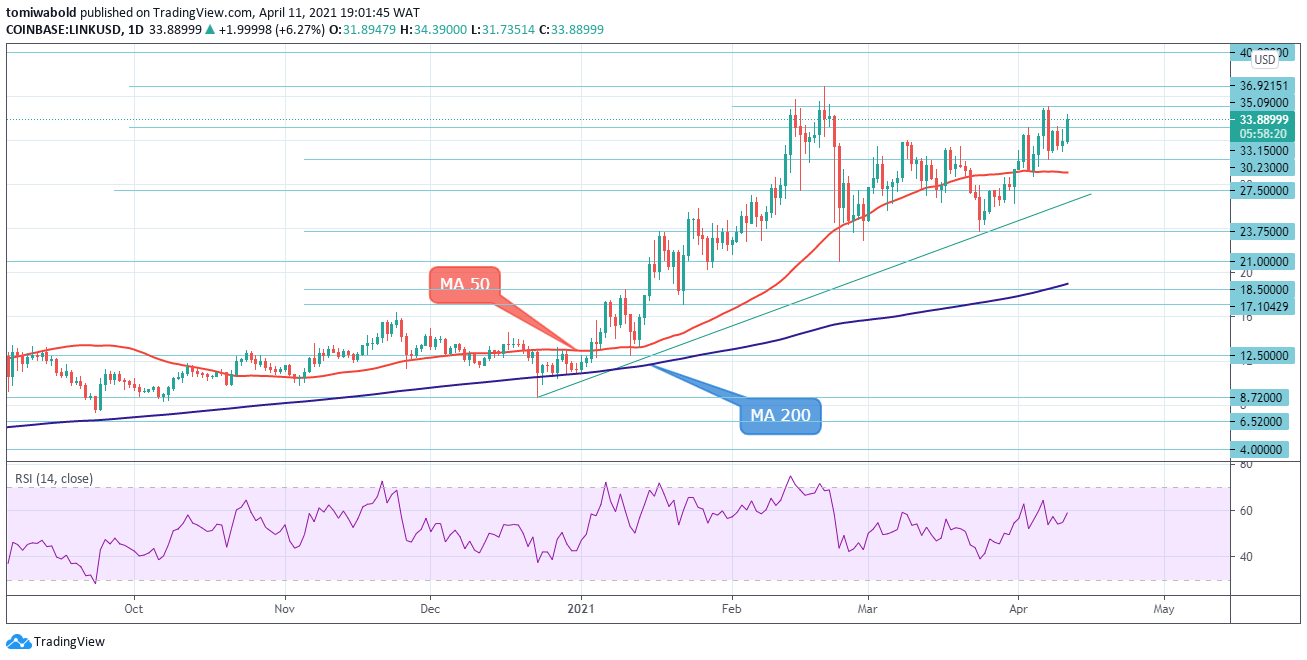
LINK Technical Analysis: Consolidation Extends on LINK/USD
The upside run in LINK/USD was halted by resistance at $35. Following that, LINK began to fall, reaching lows of $30.23. This level provided support, allowing for a modest recovery to $34.90 at the time of writing. Chainlink's limited price movement was a continuation of the price consolidation that began in mid-February after LINK reached a high of $36.92.
Bearish traders will target the MA 50 at $29.10 if the market continues to fall. LINK may find support for a rally at $30.23, just above the daily MA 50. If this fails, LINK will try to break through the $23.75 horizontal support line. If the $35 resistance level is broken, a push back well above all-time high of $36.92 is possible.
Supply Levels: $40.00, $36.92, $35.09
Demand Levels: $30.23, $27.50, $23.75
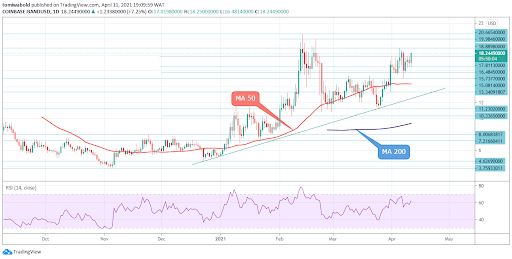
BAND Technical Analysis: Amid Selloff, Buyers Re-Attempt Lifting Price
During the previous week's market sell-off, there was a partial unwinding of previous price gains, resulting in a drop to lows of $15.08 before a rebound. BAND was trading near the mid-$18 range at the start of the new week. Any gains would be met with resistance at $20, which kept BAND/USD in the red for the entire month of March.
Bearish traders, on the other hand, may set their sights on the MA 50 at $14.30 in the coming trading sessions. Further declines could push the price below the $13.34 support level. The bears may be able to push the price down to $11.23, bringing BAND back into its consolidation range. BAND continues in a range.
Supply Levels: $20.66, $19.98, $18.88
Demand Levels: $16.48, $15.08, $13.34
To summarize, ZAP has seen a significant rise over the years and it is currently underpriced and demonstrates stronger potential than BAND and LINK, up by 15,366.95% from its Nov. 2019 all-time lows whereas BAND is up by 8,253.02% from the lows set around the same time.
The start of the rollout of ZAP Protocol Beta 2.0 last month is another positive development for this token which should improve investor sentiment despite its price being quite lethargic in recent weeks.
Specifically, this rollout will significantly lower the barrier to entry to DeFi by replacing complex mathematics and code with point and click functionality, making the process more streamlined and accessible.
The information has been prepared for information purposes only. The document is not intended as personalized investment advice and does not constitute a recommendation to buy, sell or hold investments described herein. This information contained herein is derived from sources we believe to be reliable, but of which we have not independently verified. FXInstructor LLC assumes no responsibilities for errors, inaccuracies or omissions in these materials, nor shall it be liable for damages arising out of any person's reliance upon this information. FXInstructor LLC does not warrant the accuracy or completeness of the information, text, graphics, links or other items contained within these materials. FXInstructor LLC shall not be liable for any indirect, incidental, or consequential damages including without limitation losses, lost revenues or lost profits that may result from these materials. Opinions and estimates constitute our judgment and are subject to change without notice. Past performance is not indicative of future results
Recommended Content
Editors’ Picks

Bitcoin Weekly Forecast: BTC nosedives below $95,000 as spot ETFs record highest daily outflow since launch
Bitcoin price continues to edge down, trading below $95,000 on Friday after declining more than 9% this week. Bitcoin US spot ETFs recorded the highest single-day outflow on Thursday since their launch in January.

Bitcoin crashes to $96,000, altcoins bleed: Top trades for sidelined buyers
Bitcoin (BTC) slipped under the $100,000 milestone and touched the $96,000 level briefly on Friday, a sharp decline that has also hit hard prices of other altcoins and particularly meme coins.

Solana Price Forecast: SOL’s technical outlook and on-chain metrics hint at a double-digit correction
Solana (SOL) price trades in red below $194 on Friday after declining more than 13% this week. The recent downturn has led to $38 million in total liquidations, with over $33 million coming from long positions.

SEC approves Hashdex and Franklin Templeton's combined Bitcoin and Ethereum crypto index ETFs
The SEC approved Hashdex's proposal for a crypto index ETF. The ETF currently features Bitcoin and Ethereum, with possible additions in the future. The agency also approved Franklin Templeton's amendment to its Cboe BZX for a crypto index ETF.

Bitcoin: 2025 outlook brightens on expectations of US pro-crypto policy
Bitcoin (BTC) price has surged more than 140% in 2024, reaching the $100K milestone in early December. The rally was driven by the launch of Bitcoin Spot Exchange Traded Funds (ETFs) in January and the reduced supply following the fourth halving event in April.

Best Forex Brokers with Low Spreads
VERIFIED Low spreads are crucial for reducing trading costs. Explore top Forex brokers offering competitive spreads and high leverage. Compare options for EUR/USD, GBP/USD, USD/JPY, and Gold.


