- Swipe is moving closer to an ascending triangle breakout likely to bolster it toward $6.
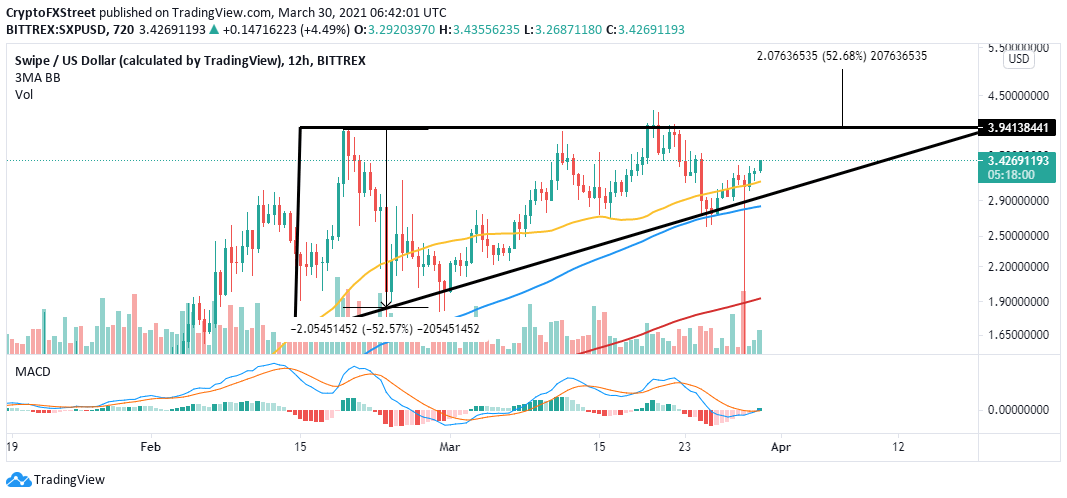
- The MACD has flipped bullish, reinforcing the uptrend.
- Declining network growth is a bearish signal that could hamper the expected upswing.
Swipe is among the crypto assets in the green during the European session on Tuesday. It has incurred almost 10% gains over the previous 24 hours, and the bullish outlook seems intact. SXP is teetering at $3.4 at the time of writing, while technical levels align for an ultimate liftoff to new all-time highs.
Swipe looks forward to a triangle breakout
Swipe is dancing within the confines of an ascending triangle pattern. Besides, the token is getting close to a breakout as it closes the gap toward the x-axis. An ascending triangle is a bullish pattern that results in a significant upswing.
The pattern usually forms after an asset has witnessed considerable growth in value, followed by a retreat. Once a support level has been established, a recovery leads to a consolidation period, succeeded by a technical breakout.
For instance, Swipe is likely to lift 55% higher if the resistance on the x-axis cracks. Triangles are known to have exact breakout targets, measured from the highest to the lowest points.
SXP/USD four-hour chart
The Moving Average Convergence Divergence (MACD) indicator has turned bullish on crossing into the positive region. Swipe's positive outlook has also been validated by the MACD line (blue) lifting above the signal line.
Looking at the other side of the picture
Swipe is dealing with declining network growth, as highlighted by Santiment's on-chain metric model. The number of new addresses joining the network topped out at 298 on March 13 over a 30-day trailing average. However, at the time of writing, the newly-created addresses stand at 114, representing a 50% slump.
Swipe network growth
It is worth noting that low or declining network growth dramatically impacts the community's level of interaction. It also reduces investor speculation while interfering with the inflow and outflow of tokens on the network. Therefore, it is usually a bearish signal when an asset's network growth slows or falls appreciably.
Information on these pages contains forward-looking statements that involve risks and uncertainties. Markets and instruments profiled on this page are for informational purposes only and should not in any way come across as a recommendation to buy or sell in these assets. You should do your own thorough research before making any investment decisions. FXStreet does not in any way guarantee that this information is free from mistakes, errors, or material misstatements. It also does not guarantee that this information is of a timely nature. Investing in Open Markets involves a great deal of risk, including the loss of all or a portion of your investment, as well as emotional distress. All risks, losses and costs associated with investing, including total loss of principal, are your responsibility. The views and opinions expressed in this article are those of the authors and do not necessarily reflect the official policy or position of FXStreet nor its advertisers. The author will not be held responsible for information that is found at the end of links posted on this page.
If not otherwise explicitly mentioned in the body of the article, at the time of writing, the author has no position in any stock mentioned in this article and no business relationship with any company mentioned. The author has not received compensation for writing this article, other than from FXStreet.
FXStreet and the author do not provide personalized recommendations. The author makes no representations as to the accuracy, completeness, or suitability of this information. FXStreet and the author will not be liable for any errors, omissions or any losses, injuries or damages arising from this information and its display or use. Errors and omissions excepted.
The author and FXStreet are not registered investment advisors and nothing in this article is intended to be investment advice.
Recommended Content
Editors’ Picks

Why AAVE is rallying even as Bitcoin, Ethereum, XRP lag
AAVE gains nearly 8% on Wednesday as crypto traders digest Bitcoin’s return above $87,000 after the flash crash. Crypto market capitalization is back above $2.9 trillion, even as institutional traders slowly lose appetite for risk assets.

Bitcoin Price Forecast: BTC expects volatility around White House Crypto summit
Bitcoin price hovers around $87,600 on Wednesday after finding support around $85,000 the previous day. US spot Exchange Traded Funds continued their outflows this week, totaling $217.7 million until Tuesday and signaling institutional demand weakness.

Bitcoin Cash Price Forecast: BCH rallies as transaction rate reaches a new all-time high
Bitcoin Cash’s price rallies more than 7% on Wednesday after retesting its key support the previous day. On-chain metrics paint a bullish picture as BCH’s transaction rate reaches a new high, and open interest is also rising.

BTC, ETH and XRP signal recovery ahead of White House Crypto Summit
Bitcoin price faced rejection around the $95,000 level on Sunday and declined 8.54% the next day. However, on Tuesday, BTC dipped below the daily support level at $85,000 but bounces and closes above it.

Bitcoin: BTC bloodbath continues, near 30% down from its ATH
Bitcoin (BTC) price extends its decline and trades below $80,000 at the time of writing on Friday, falling over 15% so far this week. This price correction wiped $660 billion of market capitalization from the overall crypto market and saw $3.68 billion in total liquidations this week.

The Best brokers to trade EUR/USD
SPONSORED Discover the top brokers for trading EUR/USD in 2025. Our list features brokers with competitive spreads, fast execution, and powerful platforms. Whether you're a beginner or an expert, find the right partner to navigate the dynamic Forex market.