SushiSwap's trading volume skyrockets, SUSHI price set to follow
- On-chain metrics are strongly bullish, suggesting that SushiSwap will rally in the short-term.
- The technical picture presents a conflicting narrative, where the price may retest $3 before recovery ensues.
SushiSwap trading volume has increased significantly over the last 30 days. Santiment shows the volume has increased from $130 million to a 30-day peak of $593 million, representing a 78% growth. Despite the surge in the volume, SUSHI price has not changed as much.
Can SushiSwap's price rally in tandem with the volume?
At the time of writing, SushiSwap's volume stands at $426 million while the price is trading at $4.1. An increase in trading volume is usually a catalyst to price action. Therefore, what could be holding SUSHI from rallying to new yearly highs?
%20[08.23.31,%2011%20Jan,%202021]-637459420046917695.png)
SushiSwap on-chain volume chart
The network growth on-chain metric by Santiment shows consistency in the number of new addresses joining the network. Over the last 30 days, newly-created addresses on the protocol have increased from 137 to 554, representing a 72.3% growth.
If this growth remains consistent, SUSHI might eventually gain momentum for a rally. Positive network growth is a bullish signal for the token's future price and the project's adoption.
%20[08.34.46,%2011%20Jan,%202021]-637459420112700227.png)
SushiSwap network growth chart
Consequently, SUSHI whales seem to be coming back from hibernation, as observed on Santiment's holder distribution model. The addresses holding between 100,000 and 1 million SUSHI have increased since the year started from 18 to 25.
Simultaneously, whales holding between 1 million and 10 million SUSHI have increased by one to 25 over the last few days. In other words, as buying pressure continues to build behind SushiSwap, the price is likely to swing upwards in the near-term.
%20[08.43.59,%2011%20Jan,%202021]-637459420176294925.png)
SushiSwap holder distribution chart
Meanwhile, the daily technical picture shows SUSHI/USD testing the support at the ascending channel's middle boundary. Moreover, the price is struggling to stay above $4 to avoid exploring the downside.
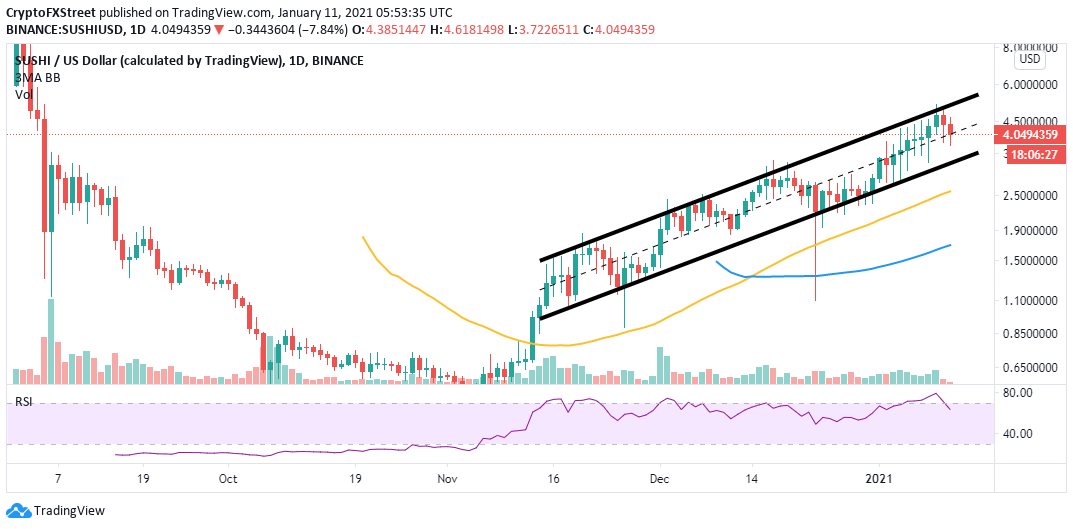
SUSHI/USD daily chart
The Relative Strength Index hints at the bearish picture remaining intact, following the rejection from the oversold area. If SushiSwap closes the day under the short term support at $4 and the middle boundary, we can expect the price to retest the channel's lower border around $3. In case the overhead pressure intensifies, SUSHI/USD might seek the anchor provided by the 50 Simple Moving Average.
Author

John Isige
FXStreet
John Isige is a seasoned cryptocurrency journalist and markets analyst committed to delivering high-quality, actionable insights tailored to traders, investors, and crypto enthusiasts. He enjoys deep dives into emerging Web3 tren


