- Sui's price recovers more than 6% on Friday after declining more than 10% earlier this week.
- On-chain metrics hint at a rally ahead as SUI’s long-to-short ratio reaches the highest level in over a month, and open interest is also rising.
- A daily candlestick close below $4.45 would invalidate the bullish thesis.
Sui (SUI) price recovers most of its weekly losses and trades around $5.06 at the time of writing on Friday. On-chain metrics hint at a rally ahead as SUI’s long-to-short ratio reaches the highest level in over a month, and open interest is also rising. The technical outlook suggests a rally continuation, projecting a new all-time high (ATH) of $6.35.
Sui bulls eye for a new all-time high of $6.35
Sui price reached an all-time high of $5.36 on Monday and declined in the following days to find support around the 61.8% Fibonacci retracement, drawn from its November 26 low of $2.96 to its all-time high of $5.36, at $4.45 on Wednesday and Thursday. At the time of writing on Friday, it trades higher and approaches its ATH level.
If SUI continues its upward momentum, it could extend the rally to a new all-time high of $6.35, the 141.40% Fibonacci extension level.
The Relative Strength Index (RSI) on the daily chart reads 60, above its neutral level of 50, and points upwards, indicating bullish momentum. The Moving Average Convergence Divergence (MACD) indicator also shows a bullish crossover, signaling a buy signal and suggesting the continuation of the uptrend.
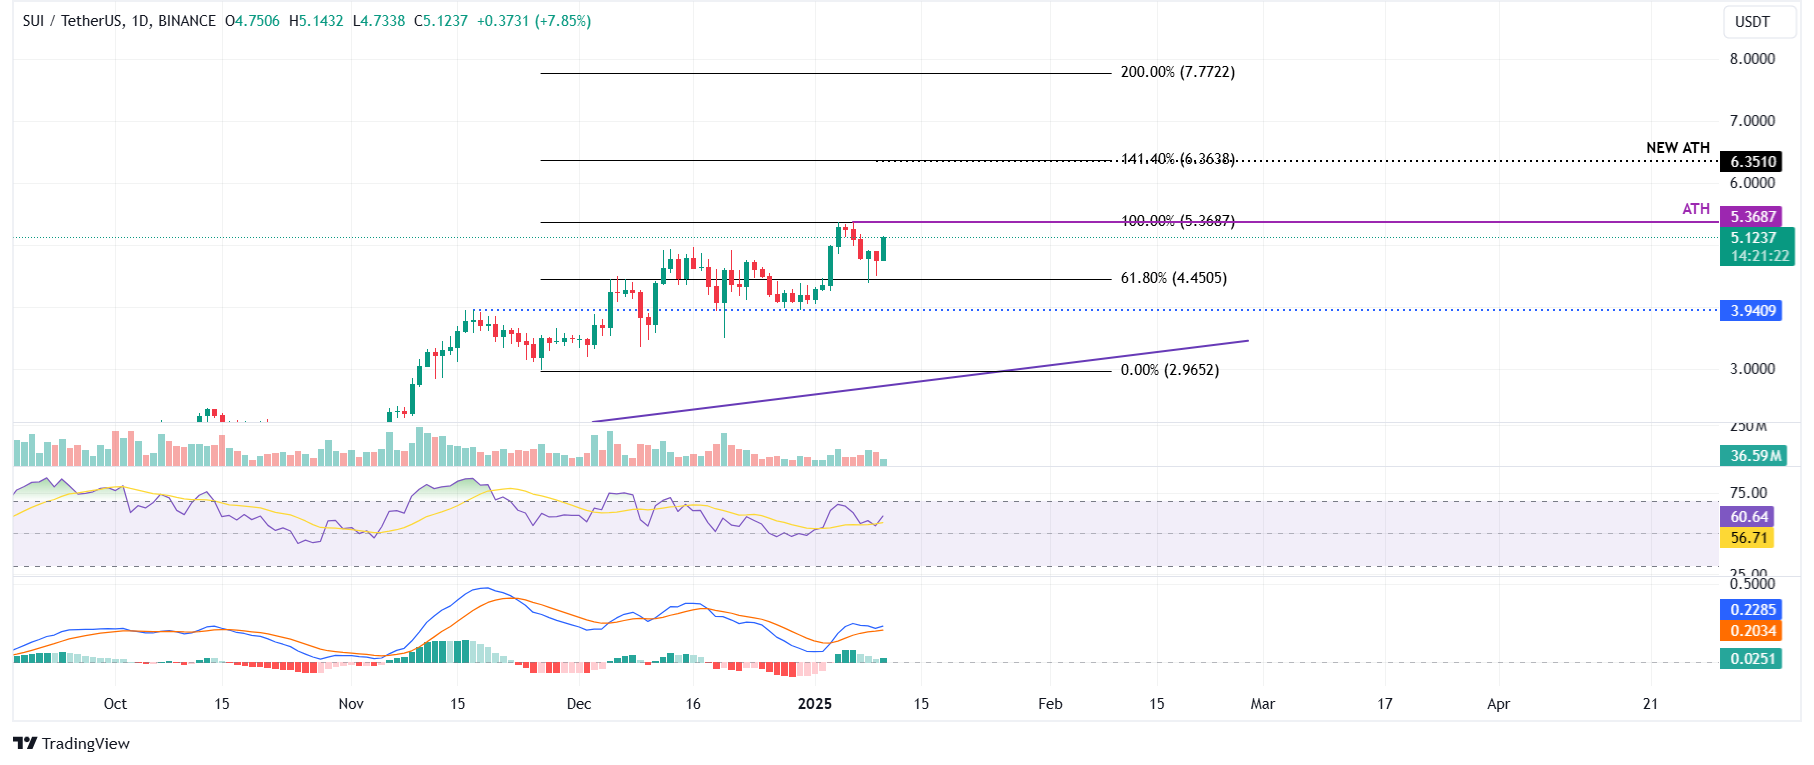
SUI/USDT daily chart
Looking at Sui’s Open Interest (OI) further boosts the bullish outlook. Coinglass’s data shows that the futures’ OI in SUI at exchanges rose from $1.20 million on Wednesday to $1.32 billion on Friday, rising since early January. An increasing OI represents new or additional money entering the market and new buying, which suggests a rally ahead in the Sui price.
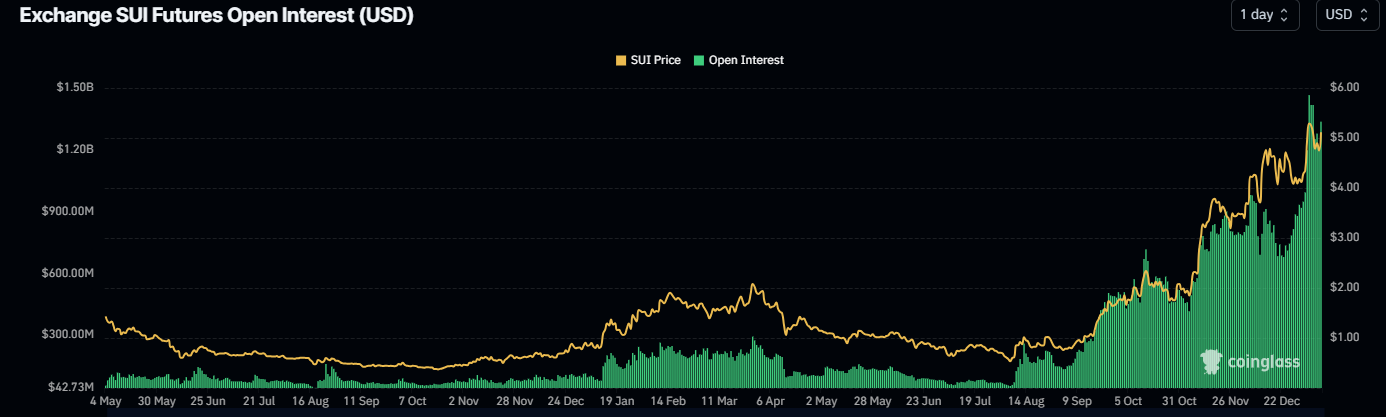
SUI Open Interest chart. Source: Coinglass
Another bullish sign is Coinglass’s SUI long-to-short ratio, which reads 1.13, the highest level in over a month. This ratio above one reflects bullish sentiment in the markets as more traders are betting for the Sui price to rise.
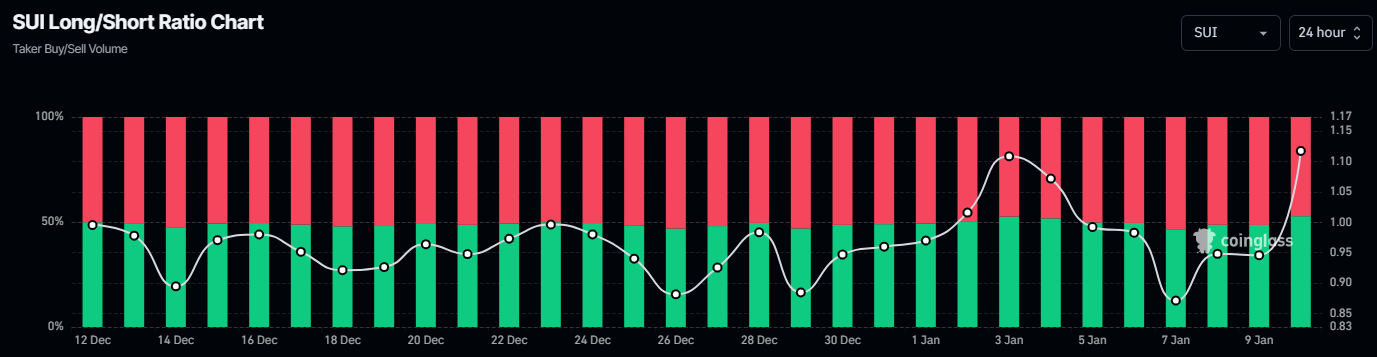
SUI long-to-short ratio chart. Source: Coinglass
However, if Sui’s daily candlestick closes below the $4.45 support, the bullish thesis would be invalidated, leading to a price decline to retest its next daily support at $3.94.
Information on these pages contains forward-looking statements that involve risks and uncertainties. Markets and instruments profiled on this page are for informational purposes only and should not in any way come across as a recommendation to buy or sell in these assets. You should do your own thorough research before making any investment decisions. FXStreet does not in any way guarantee that this information is free from mistakes, errors, or material misstatements. It also does not guarantee that this information is of a timely nature. Investing in Open Markets involves a great deal of risk, including the loss of all or a portion of your investment, as well as emotional distress. All risks, losses and costs associated with investing, including total loss of principal, are your responsibility. The views and opinions expressed in this article are those of the authors and do not necessarily reflect the official policy or position of FXStreet nor its advertisers. The author will not be held responsible for information that is found at the end of links posted on this page.
If not otherwise explicitly mentioned in the body of the article, at the time of writing, the author has no position in any stock mentioned in this article and no business relationship with any company mentioned. The author has not received compensation for writing this article, other than from FXStreet.
FXStreet and the author do not provide personalized recommendations. The author makes no representations as to the accuracy, completeness, or suitability of this information. FXStreet and the author will not be liable for any errors, omissions or any losses, injuries or damages arising from this information and its display or use. Errors and omissions excepted.
The author and FXStreet are not registered investment advisors and nothing in this article is intended to be investment advice.
Recommended Content
Editors’ Picks

XRP chart signals 27% jump after SEC-Ripple appeals pause and $50 million settlement
Ripple (XRP) stabilized above $2.00 exemplifying a similar pattern to the largest cryptocurrency by market capitalization, Bitcoin (BTC), which holds firmly above $84,000 at the time of writing on Thursday.

Bitwise lists four crypto ETPs on London Stock Exchange
Bitwise announced on Wednesday that it had listed four of its Germany-issued crypto Exchange-Traded products (ETPs) on the London Stock Exchange. It aims to expand access to its products for Bitcoin (BTC) and Ethereum (ETH) investors and widen its footprint across European markets.

RAY sees double-digit gains as Raydium unveils new Pumpfun competitor
RAY surged 10% on Wednesday as Raydium revealed its new meme coin launchpad, LaunchLab, a potential competitor to Pump.fun — which also recently unveiled its decentralized exchange (DEX) PumpSwap.

Ethereum Price Forecast: ETH face value- accrual risks due to data availability roadmap
Ethereum (ETH) declined 1%, trading just below $1,600 in the early Asian session on Thursday, as Binance Research's latest report suggests that the data availability roadmap has been hampering its value accrual.

Bitcoin Weekly Forecast: Market uncertainty lingers, Trump’s 90-day tariff pause sparks modest recovery
Bitcoin (BTC) price extends recovery to around $82,500 on Friday after dumping to a new year-to-date low of $74,508 to start the week. Market uncertainty remains high, leading to a massive shakeout, with total liquidations hitting $2.18 billion across crypto markets.

The Best brokers to trade EUR/USD
SPONSORED Discover the top brokers for trading EUR/USD in 2025. Our list features brokers with competitive spreads, fast execution, and powerful platforms. Whether you're a beginner or an expert, find the right partner to navigate the dynamic Forex market.