• XLM is trading at $0.0762 and faces steep resistance ahead.
  • Several indicators are showing XLM could be on the verge of a pullback.

Stellar gained around $230 million in market capitalization over the past week after a significant bull move from $0.07 to a peak of $0.079 on October 12. It seems that XLM could be facing some short-term resistance, according to numerous indicators. 

XLM gets ready for a pullback

On the daily chart, we can observe several indicators turning against XLM. First of all, we have the moving averages, the 50-SMA at $0.0797 is acting as a healthy resistance level. Similarly, the 200-SMA has acted as a resistance point for several days in the past and has just rejected the price again.

XLM/USD daily chart

xlm price

Perhaps the most concerning sign is the TD sequential indicator, which has presented a sell signal on the daily chart. The last time it flashed this signal, the price of XLM dropped 28% within the next three weeks. A similar drop would take XLM down to $0.054. However, there is a support level above at $0.067. 

XLM/USD 4-hour chart

xlm price

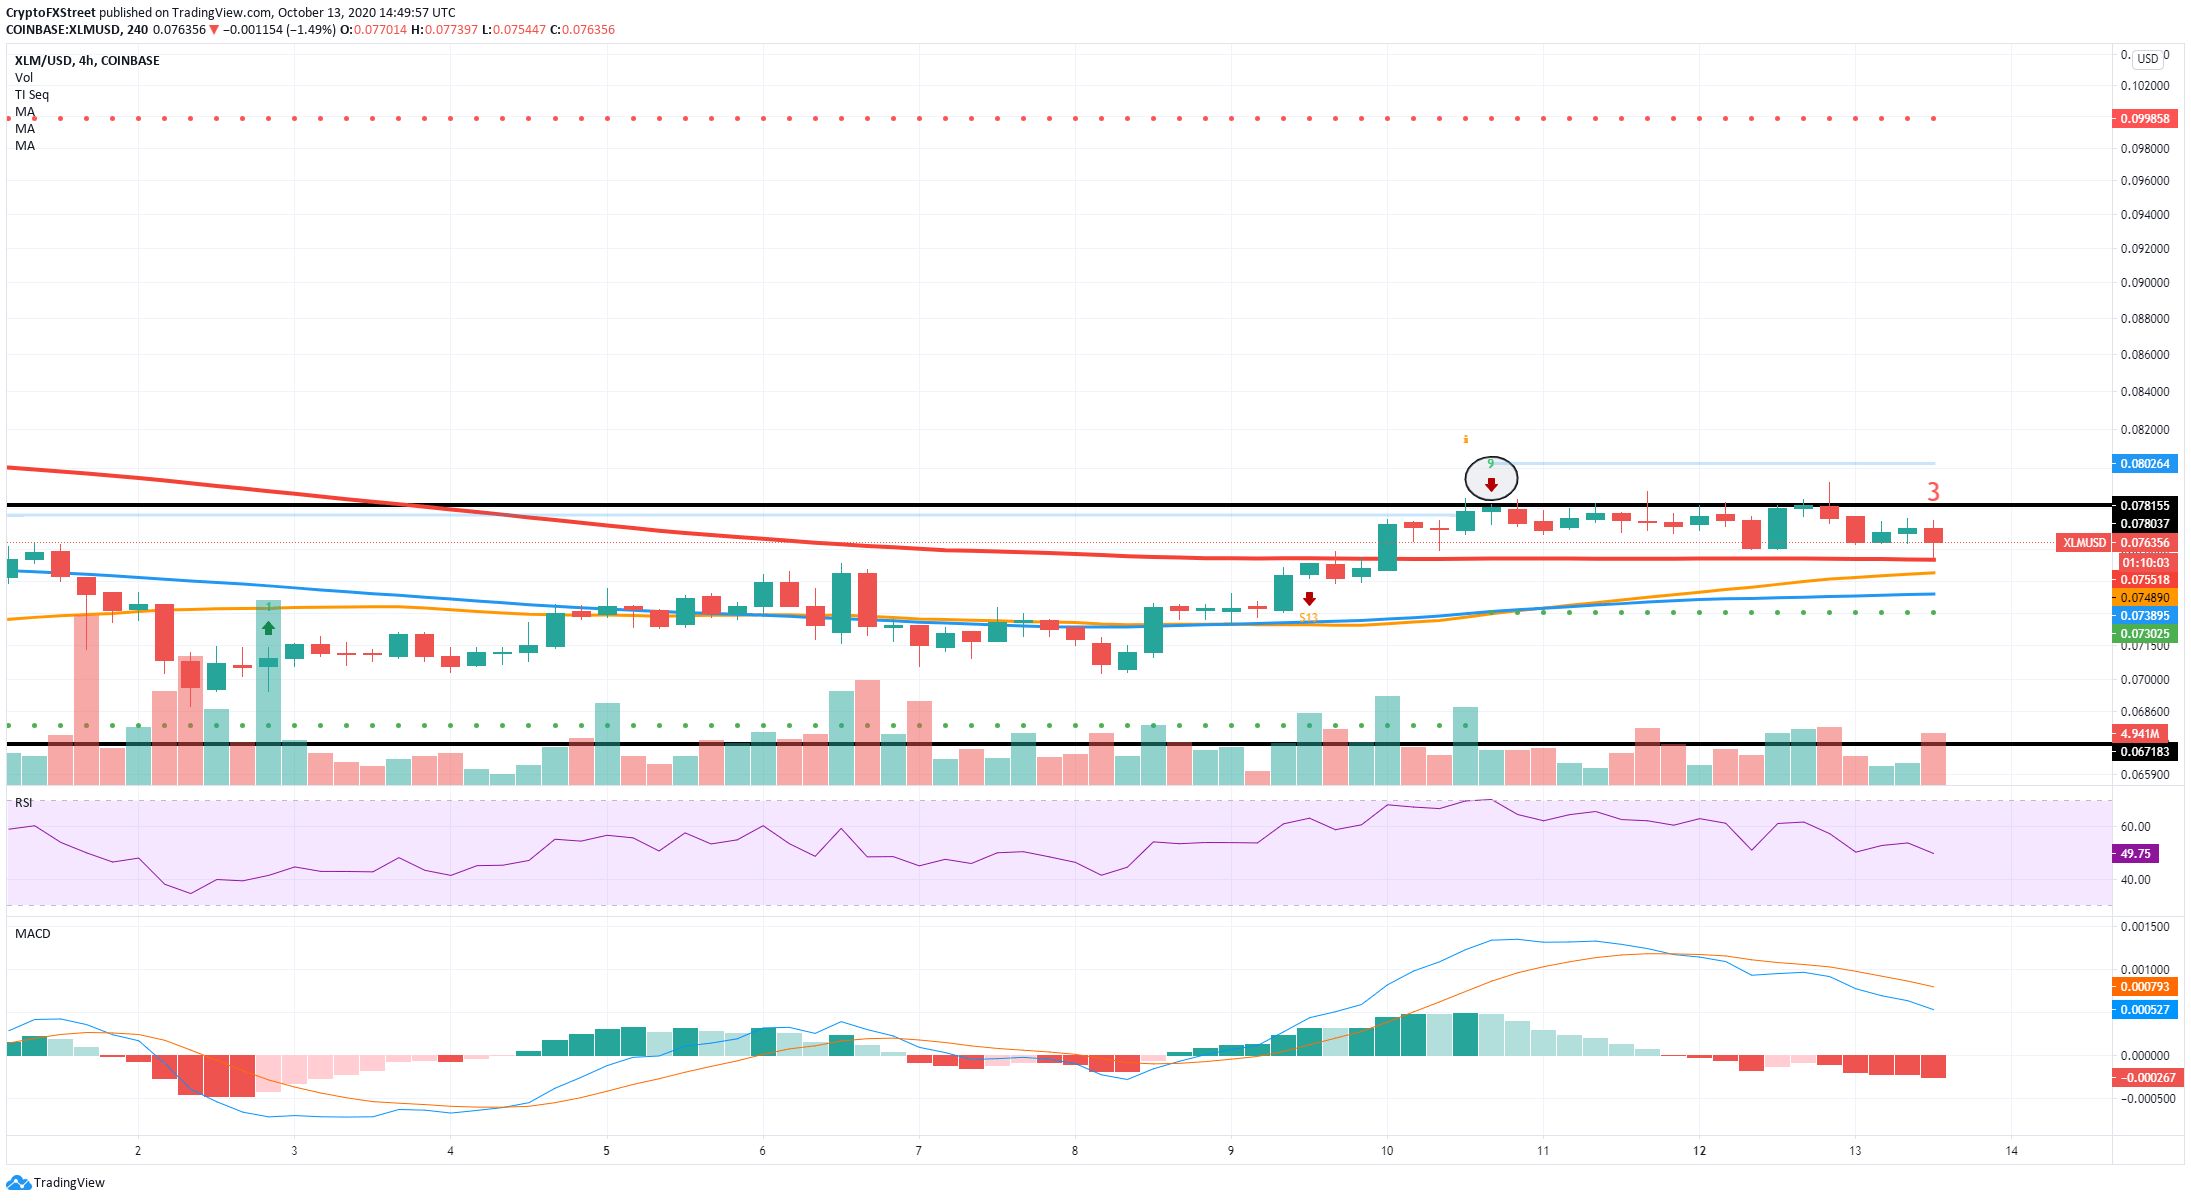
On the other hand, on the 4-hour chart, the last sell signal presented by the TD sequential indicator was invalidated by sideways trading. More importantly, bulls are currently defending all three SMAs. The nearest is the 200-SMA at $0.076, which has acted as a healthy support level for the past three days.

The most crucial resistance level was established at $0.078 and tested several times between October 10 and today. A breakout above this point can push the digital asset to $0.08, where the 50-SMA stands on the daily chart and up to $0.09, the 100-SMA.

Critical points to look out for

On the bearish side, if the selling pressure continues mounting and the price of XLM gets rejected from the 50-SMA on the daily chart, we could see bears attempt to break $0.07 and take XLM down to $0.067, the nearest support level with a maximum price target of $0.054. 

If the bulls can defend the 200-SMA at $0.076 on the 4-hour chart, they will have a real chance of pushing XLM towards $0.08 in the short-term. The longer-term price target would be $0.09, where the 50-SMA is established on the daily chart.


Note: All information on this page is subject to change. The use of this website constitutes acceptance of our user agreement. Please read our privacy policy and legal disclaimer. Opinions expressed at FXstreet.com are those of the individual authors and do not necessarily represent the opinion of FXstreet.com or its management. Risk Disclosure: Trading foreign exchange on margin carries a high level of risk, and may not be suitable for all investors. The high degree of leverage can work against you as well as for you. Before deciding to invest in foreign exchange you should carefully consider your investment objectives, level of experience, and risk appetite. The possibility exists that you could sustain a loss of some or all of your initial investment and therefore you should not invest money that you cannot afford to lose. You should be aware of all the risks associated with foreign exchange trading, and seek advice from an independent financial advisor if you have any doubts.

Join Telegram

Recommended content


Recommended Content

Editors’ Picks

Celebrity meme coins controversy continues amid Pump.fun revenue dominance

Celebrity meme coins controversy continues amid Pump.fun revenue dominance

Pump.fun outperformed the Ethereum blockchain on Tuesday after raking in $1.99 million. Following this achievement, a meme coin based on actress Sydney Sweeney was the subject of controversy after its developers dumped their bags on investors.

More Meme Coins News

PEPE's on-chain metrics indicate potential rally after weeks of silence

PEPE's on-chain metrics indicate potential rally after weeks of silence

PEPE has struggled to see any significant price move after reaching an all-time high in May. Increased adoption rate and low MVRV ratio indicate a bullish run may be on the horizon. A single PEPE outflow from Binance worth $14.7 million gives credence to signs of bullish expectation.

More Pepe News

Ethereum has failed to overcome key resistance despite bullish sentiment surrounding ETH ETF

Ethereum has failed to overcome key resistance despite bullish sentiment surrounding ETH ETF

Ethereum (ETH) is down more than 1.4% on Tuesday following another ETH sale from the Ethereum Foundation. Meanwhile, crypto exchange Gemini's recent report reveals that ETH ETF could see about $5 billion in net inflows within six months of launch.

More Ethereum News

Crypto community blasts Polkadot following report of treasury spending

Crypto community blasts Polkadot following report of treasury spending

Polkadot reports $87 million of treasury spending during H1. Crypto community members expressed harsh feelings toward the DOT team's high spending. DOT is up more than 2% in the past 24 hours but risks correction following the report.

More Polkadot News

Bitcoin: BTC price correction could end in July, according to seasonal data

Bitcoin: BTC price correction could end in July, according to seasonal data

Bitcoin (BTC) price appears poised for a decline this week, influenced by slight outflows in US spot ETFs, selling activity among BTC miners, and a combined transfer of 4,690.28 BTC to centralized exchanges by the US and German governments.

Read full analysis

BTC

ETH

XRP