- Stellar price hovers around $0.40 on Thursday after falling 3.4% in the last two days.
- An upward resolution of a symmetrical triangle would open a target at $0.84.
- A daily candlestick close below $0.35 would invalidate the bullish thesis.
Stellar’s (XLM) price hovers around $0.40 on Thursday after falling by 3.4% in the last two days. The technical outlook shows the formation of a symmetrical triangle if it breaks above the target at the $0.84 level, which is 110% of its current trading levels.
Stellar could rally if it breaks above the symmetrical triangle
Stellar price trades inside a symmetrical triangle, a technical pattern formed by connecting multiple highs and lows with two converging trendlines (from the end of November to mid-January). This technical pattern has a bullish bias, and the target is generally obtained by measuring the distance between the first swing high and the first swing low to the breakout point.
On Monday, the Stellar price was retested, and support was found around the lower trendline of the symmetrical triangle. However, it declined slightly by 3.4% until Wednesday. At the time of writing on Thursday, it recovers slightly and trades around $0.40..
Assuming the breakout happens by closing a daily candlestick above the daily resistance level at $0.49, the technical target obtained by this pattern would be $0.84, which is 111% of its current trading level. Investors should be cautious of this theoretical move as it could face a slowdown after a 58% rally to retest its November 24 high of $0.63 as traders could opt to book profits.
For the bullish outlook to play out, Stellar’s Relative Strength Index (RSI) indicator on the daily chart must maintain levels above its neutral level of 50, and the Moving Average Convergence Divergence (MACD) indicator must also show a bullish crossover on a daily basis.
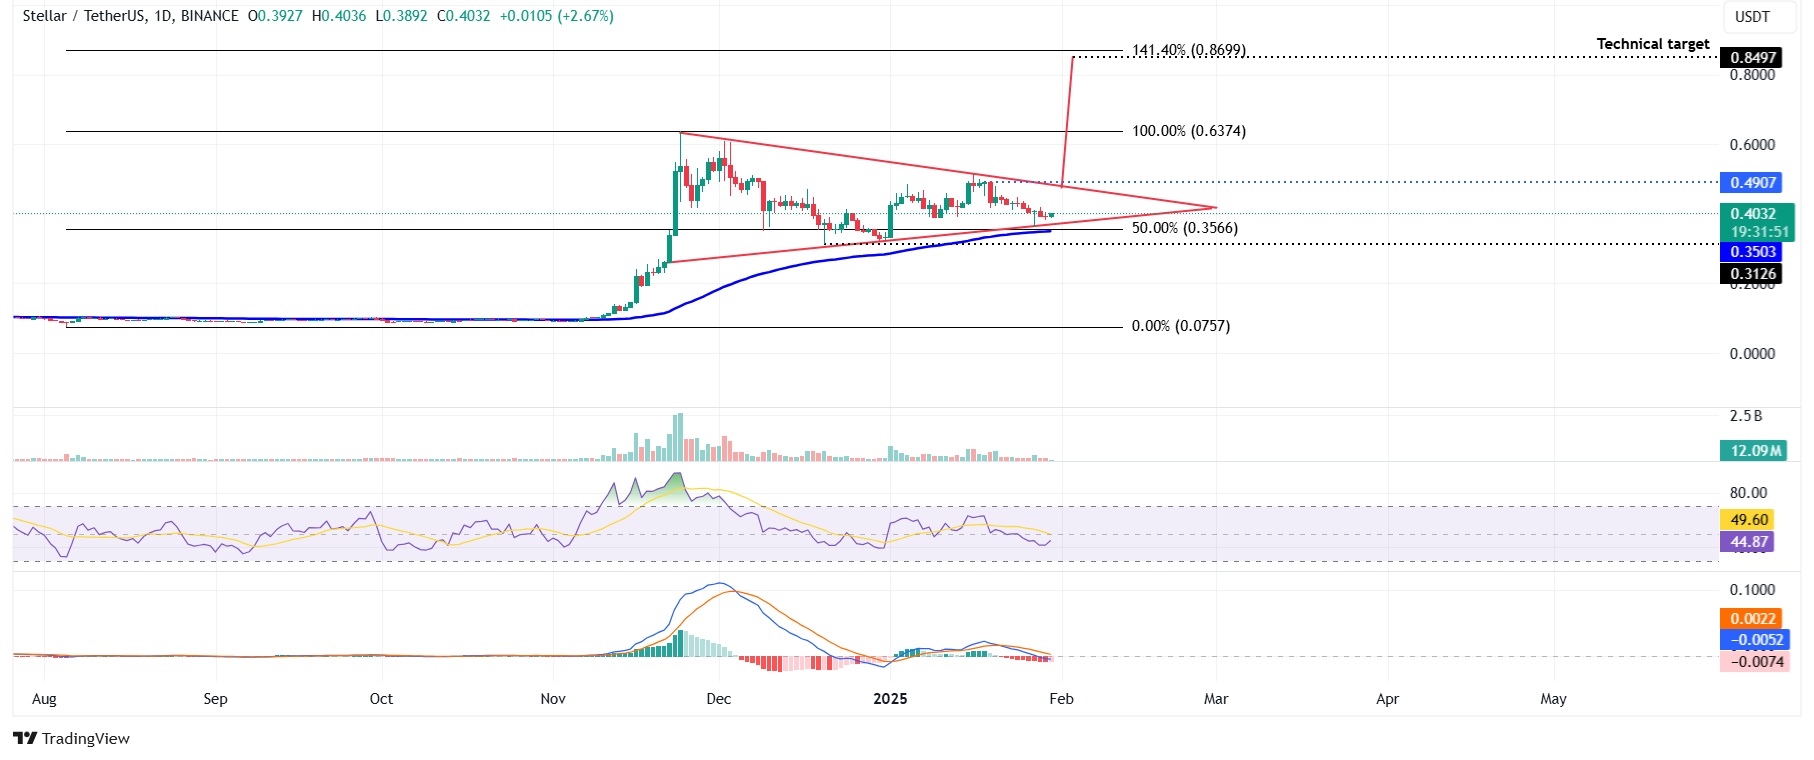
XLM/USDT daily chart
However, the bullish thesis would be invalidated if XLM breaks below its lower trendline of the symmetrical triangle and closes below its 200-day Exponential Moving Average (EMA) at $0.35. This bearish price action would extend the decline to test its December 20 low of $0.31.
Information on these pages contains forward-looking statements that involve risks and uncertainties. Markets and instruments profiled on this page are for informational purposes only and should not in any way come across as a recommendation to buy or sell in these assets. You should do your own thorough research before making any investment decisions. FXStreet does not in any way guarantee that this information is free from mistakes, errors, or material misstatements. It also does not guarantee that this information is of a timely nature. Investing in Open Markets involves a great deal of risk, including the loss of all or a portion of your investment, as well as emotional distress. All risks, losses and costs associated with investing, including total loss of principal, are your responsibility. The views and opinions expressed in this article are those of the authors and do not necessarily reflect the official policy or position of FXStreet nor its advertisers. The author will not be held responsible for information that is found at the end of links posted on this page.
If not otherwise explicitly mentioned in the body of the article, at the time of writing, the author has no position in any stock mentioned in this article and no business relationship with any company mentioned. The author has not received compensation for writing this article, other than from FXStreet.
FXStreet and the author do not provide personalized recommendations. The author makes no representations as to the accuracy, completeness, or suitability of this information. FXStreet and the author will not be liable for any errors, omissions or any losses, injuries or damages arising from this information and its display or use. Errors and omissions excepted.
The author and FXStreet are not registered investment advisors and nothing in this article is intended to be investment advice.
Recommended Content
Editors’ Picks

Bitcoin Weekly Forecast: BTC remains calm before a storm
Bitcoin price has been consolidating between $85,000 and $88,000 this week, approaching the lower boundary of the consolidation range when writing on Friday. A K33 Research report explains how the markets are relatively calm and shaping up for volatility as investors absorb the tariff announcements.

Donald Trump’s tariff policies set to increase market uncertainty and risk-off sentiment
US President Donald Trump’s tariff policies are expected to escalate market uncertainty and risk-off sentiment, with the Kobeissi Letter’s post on X this week cautioning that while markets may view the April 2 tariffs as the "end of uncertainty," it anticipates increased volatility.

Ethereum Price Forecast: Whales increase buying pressure as developers set April 30 for Pectra mainnet upgrade
Ethereum developers tentatively scheduled the Pectra mainnet upgrade for April 30 in the latest ACDC call. Whales have stepped up their buying pressure in hopes of a price uptick upon Pectra going live on mainnet.

BTC stabilizes while ETH and XRP show weakness
Bitcoin price stabilizes at around $87,000 on Friday, as its RSI indicates indecisiveness among traders. However, Ethereum and Ripple show signs of weakness as they face resistance around their key levels and face a pullback this week.
Bitcoin: BTC remains calm before a storm
Bitcoin (BTC) price has been consolidating between $85,000 and $88,000 this week, approaching the lower boundary of the consolidation range when writing on Friday.

The Best brokers to trade EUR/USD
SPONSORED Discover the top brokers for trading EUR/USD in 2025. Our list features brokers with competitive spreads, fast execution, and powerful platforms. Whether you're a beginner or an expert, find the right partner to navigate the dynamic Forex market.