![]() Lorenzo Stroe
Lorenzo Stroe
Independent Analyst
- Stellar price is currently bounded inside a symmetrical triangle pattern on the 12-hour chart.
- The digital asset has bounced off the lower trendline support level and aims for $0.185.
- On-chain metrics suggest that XLM could be poised for a major correction.
After setting a high at $0.233 on November 25, Stellar entered a period of consolidation and remains trading inside a tightening pattern on the 12-hour chart. Several indicators present conflicting data favoring bears and bulls.
Stellar price could jump to $0.185 before a major correction
Stellar is contained inside a symmetrical triangle pattern on the 12-hour chart. The digital asset has just defended the lower trendline support level at $0.165 and aims to rebound higher. The bulls need to reconquer the 50-SMA level as support.
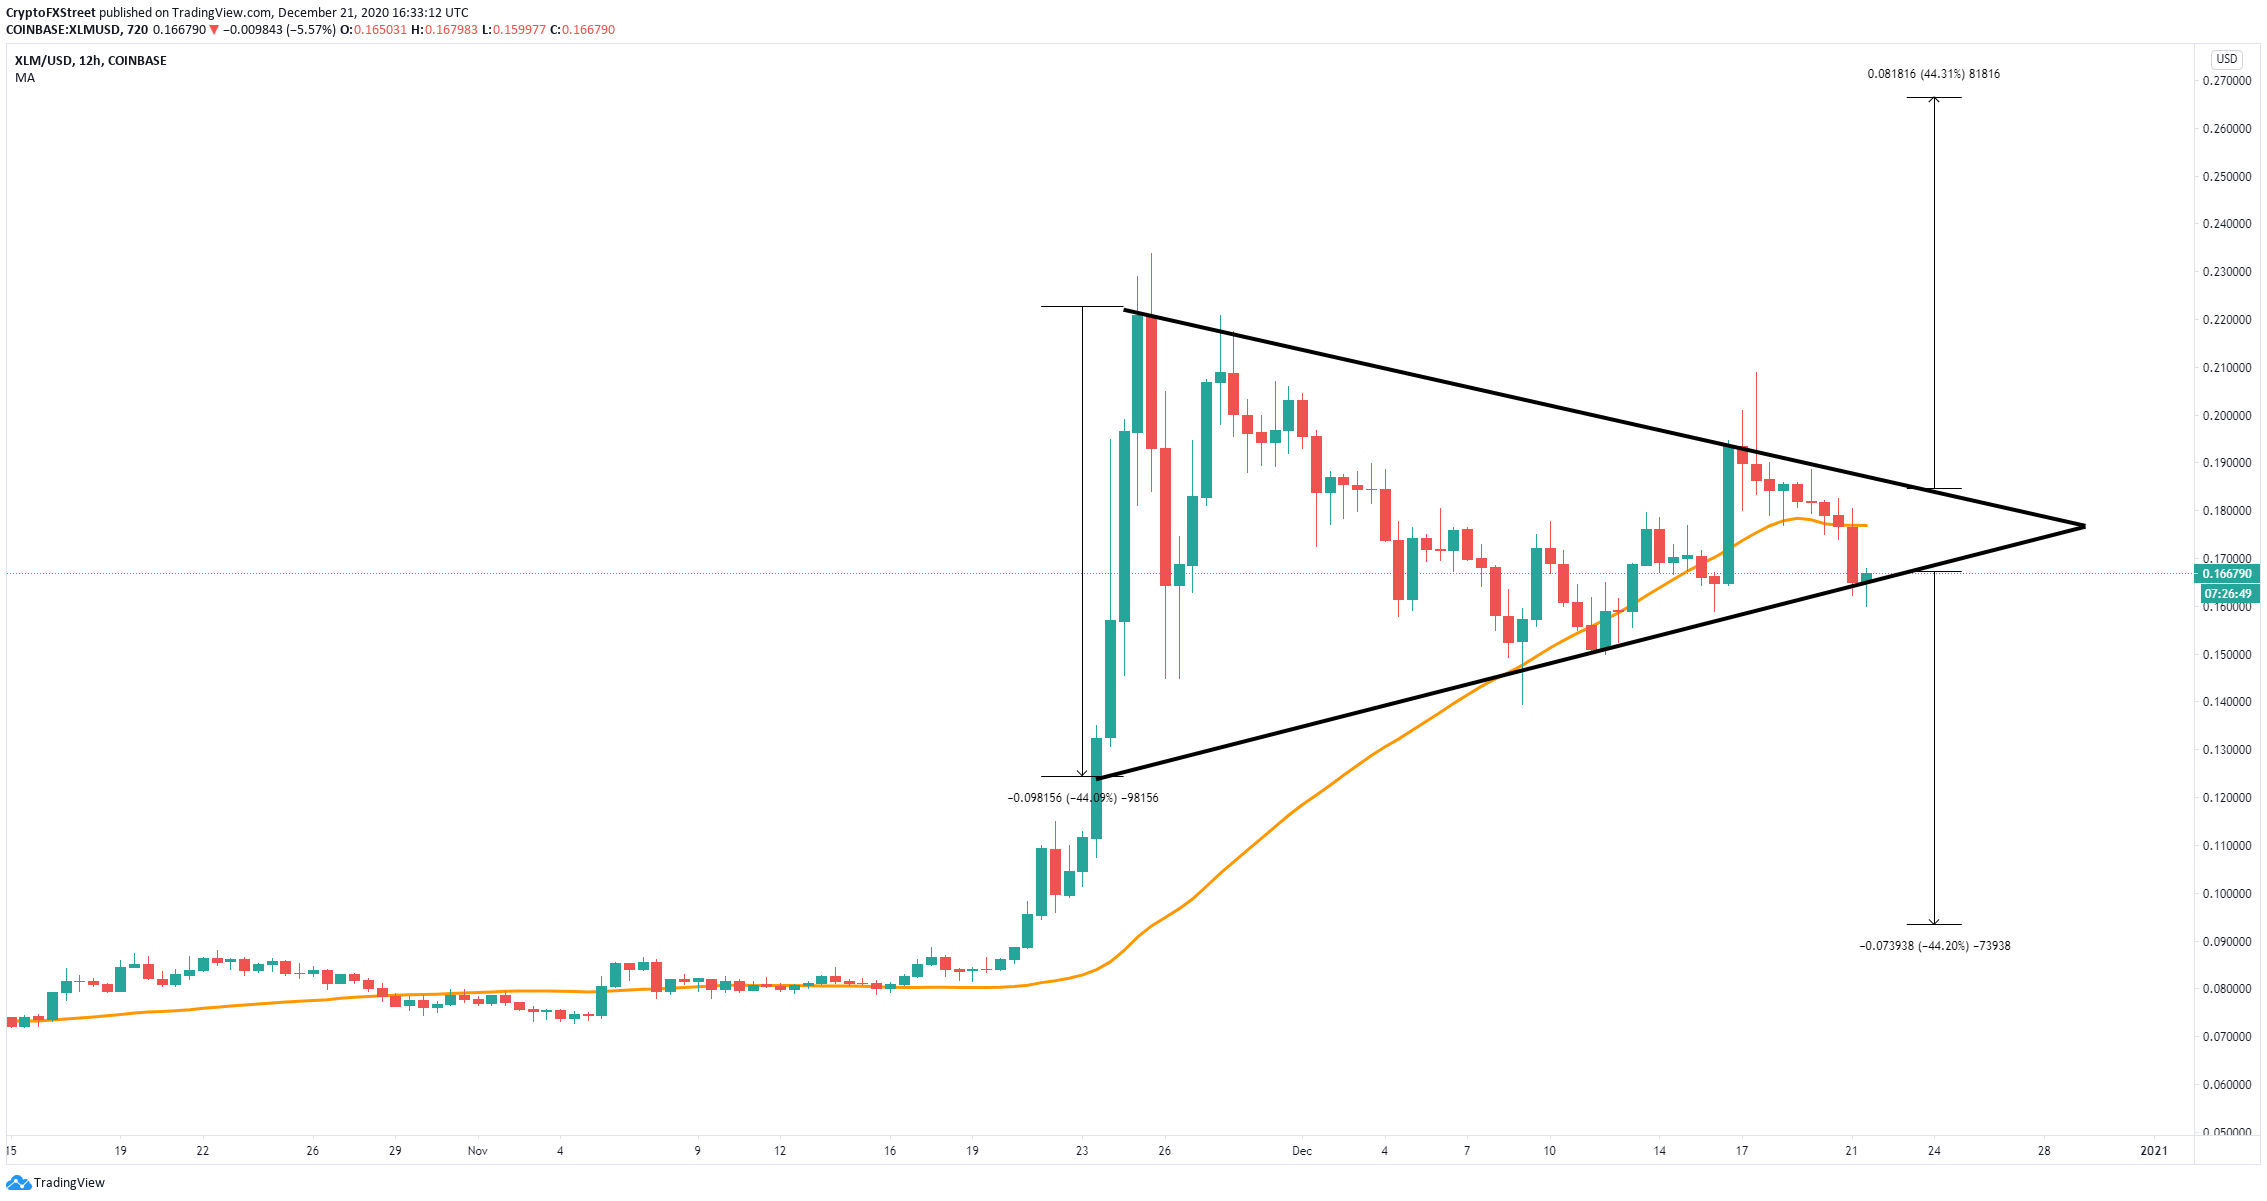
XLM/USD 12-hour chart
Pushing through the 50-SMA will most likely lead XLM towards the upper trendline resistance level. A breakout above this point can quickly drive Stellar price towards $0.27, a 44% jump using the height of the pattern as a reference point.
However, it seems that the 30-day volatility metric has jumped to levels not seen since January 2018 when Stellar experienced a massive correction from its all-time high at $0.88. The metric could be hinting at another potential major pullback for XLM.
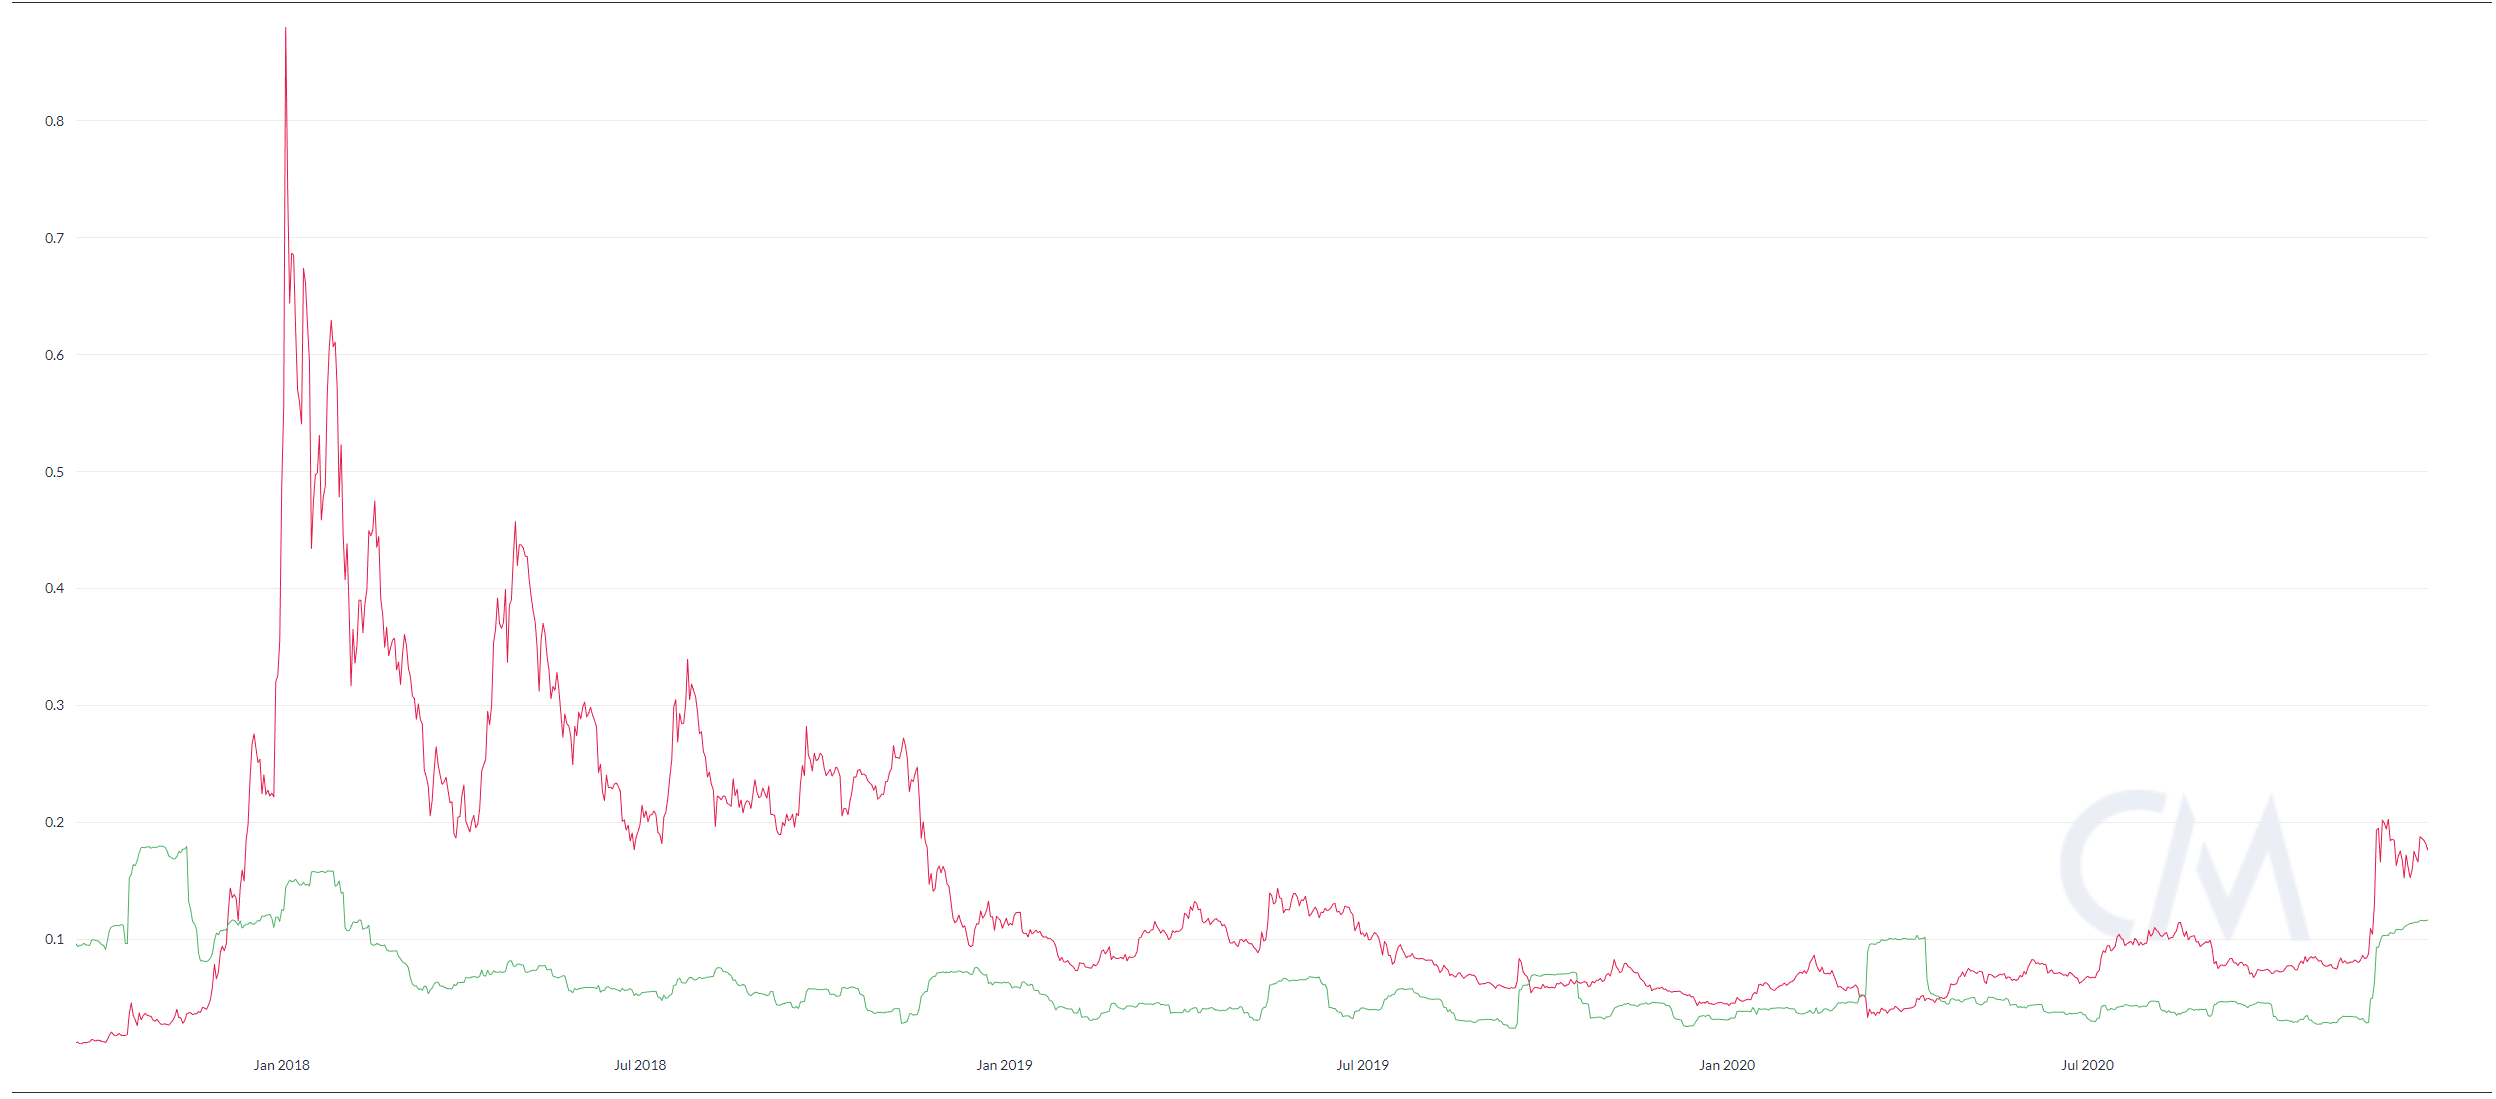
XLM 30-day volatility chart
Bears have managed to push Stellar price below the 50-SMA and the digital asset might be on the verge of a breakdown below the critical support level at $0.165. Losing this level will push XLM down to $0.093.
Note: All information on this page is subject to change. The use of this website constitutes acceptance of our user agreement. Please read our privacy policy and legal disclaimer. Opinions expressed at FXstreet.com are those of the individual authors and do not necessarily represent the opinion of FXstreet.com or its management. Risk Disclosure: Trading foreign exchange on margin carries a high level of risk, and may not be suitable for all investors. The high degree of leverage can work against you as well as for you. Before deciding to invest in foreign exchange you should carefully consider your investment objectives, level of experience, and risk appetite. The possibility exists that you could sustain a loss of some or all of your initial investment and therefore you should not invest money that you cannot afford to lose. You should be aware of all the risks associated with foreign exchange trading, and seek advice from an independent financial advisor if you have any doubts.
Recommended Content
Editors’ Picks

Crypto fraud soars as high-risk addresses on Ethereum, TRON networks receive $278 billion
The cryptocurrency industry is growing across multiple facets, including tokenized real-world assets, futures and spot ETFs, stablecoins, Artificial Intelligence (AI), and its convergence with blockchain technology, as well as the dynamic decentralized finance (DeFi) sector.

Bitcoin eyes $100,000 amid Arizona Reserve plans, corporate demand, ETF inflows
Bitcoin price is stabilizing around $95,000 at the time of writing on Tuesday, and a breakout suggests a rally toward $100,000. The institutional and corporate demand supports a bullish thesis, as US spot ETFs recorded an inflow of $591.29 million on Monday, continuing the trend since April 17.

Meme coins to watch as Bitcoin price steadies
Bitcoin price hovers around $95,000, supported by continued spot BTC ETFs’ inflows. Trump Official is a key meme coin to watch ahead of a stakeholder dinner to be attended by President Donald Trump. Dogwifhat price is up 47% in April and looks set to post its first positive monthly returns this year.

Cardano Lace Wallet integrates Bitcoin, boosting cross-chain capabilities
Cardano co-founder Charles Hoskinson announced Monday that Bitcoin is integrated into the Lace Wallet, expanding Cardano’s ecosystem and cross-chain capabilities. This integration enables users to manage BTC alongside Cardano assets, providing support for multichain functionality.
Bitcoin Weekly Forecast: BTC consolidates after posting over 10% weekly surge
Bitcoin (BTC) price is consolidating around $94,000 at the time of writing on Friday, holding onto the recent 10% increase seen earlier this week.

The Best brokers to trade EUR/USD
SPONSORED Discover the top brokers for trading EUR/USD in 2025. Our list features brokers with competitive spreads, fast execution, and powerful platforms. Whether you're a beginner or an expert, find the right partner to navigate the dynamic Forex market.