Stellar Price Analysis: XLM ripe for correction after 70% gains
- Stellar developers launched a new version of the protocol.
- XLM/USD may be ready for a correction after a significant upside momentum.

Stellar (XLM) broke above $0.18 for the first time since November 2018 and hit a new multi-year high at $0.188. At the time of writing, XLM/USD is changing hands at $0.16, having gained nearly 70% in the past 24 hours and over 115% on a week-to-week basis.
Stellar is the 11th largest digital asset with a current market capitalization of $3.8 billion and an average daily trading volume of $2 billion. Notably, since the past weekend, Stellar's trading volumes increased tenfold.
Stellar rolls out 15th version of the protocol
On November 23, Stellar developers upgraded the network to Protocol 15. According to the blog post by the head of the Ecosystem at the Stellar Development Foundation, Justin Rice, the much-awaited upgrade contains two significant improvements that will make building apps on the blockchain much easier.
Protocol 15 includes two new features — Claimable Balances and Sponsored Reserves — making it easier than ever to build user-friendly apps on Stellar. We've already seen both deployed to a significant effect on the testnet, and we're excited to see what you can do with them in a production environment.
Rice further explained that users might experience problems with network integration if they haven't updated their Stellar-related software.
So if you're reading this sometime after 11/23/20, and you're having trouble with your Stellar integration, there's a good chance upgrading is still the solution you're after, he wrote
Notably, the team skipped Protocol 14 due to a critical bug discovered during the testing phase. The developers fixed the issues in a new version.
The bearish correction is on the way
Stellar is grossly overbought from the technical point of view and may be ready for a downside correction. The TD Sequential indicator printed a sell signal in the form of a nine green candlestick on 4-hour, 12-hour, and daily charts. If the bearish scenario is confirmed, the price may enter the correction for one to four red candlestick.
Moreover, if the downside starts gaining traction, Stellar will create a new bearish countdown.
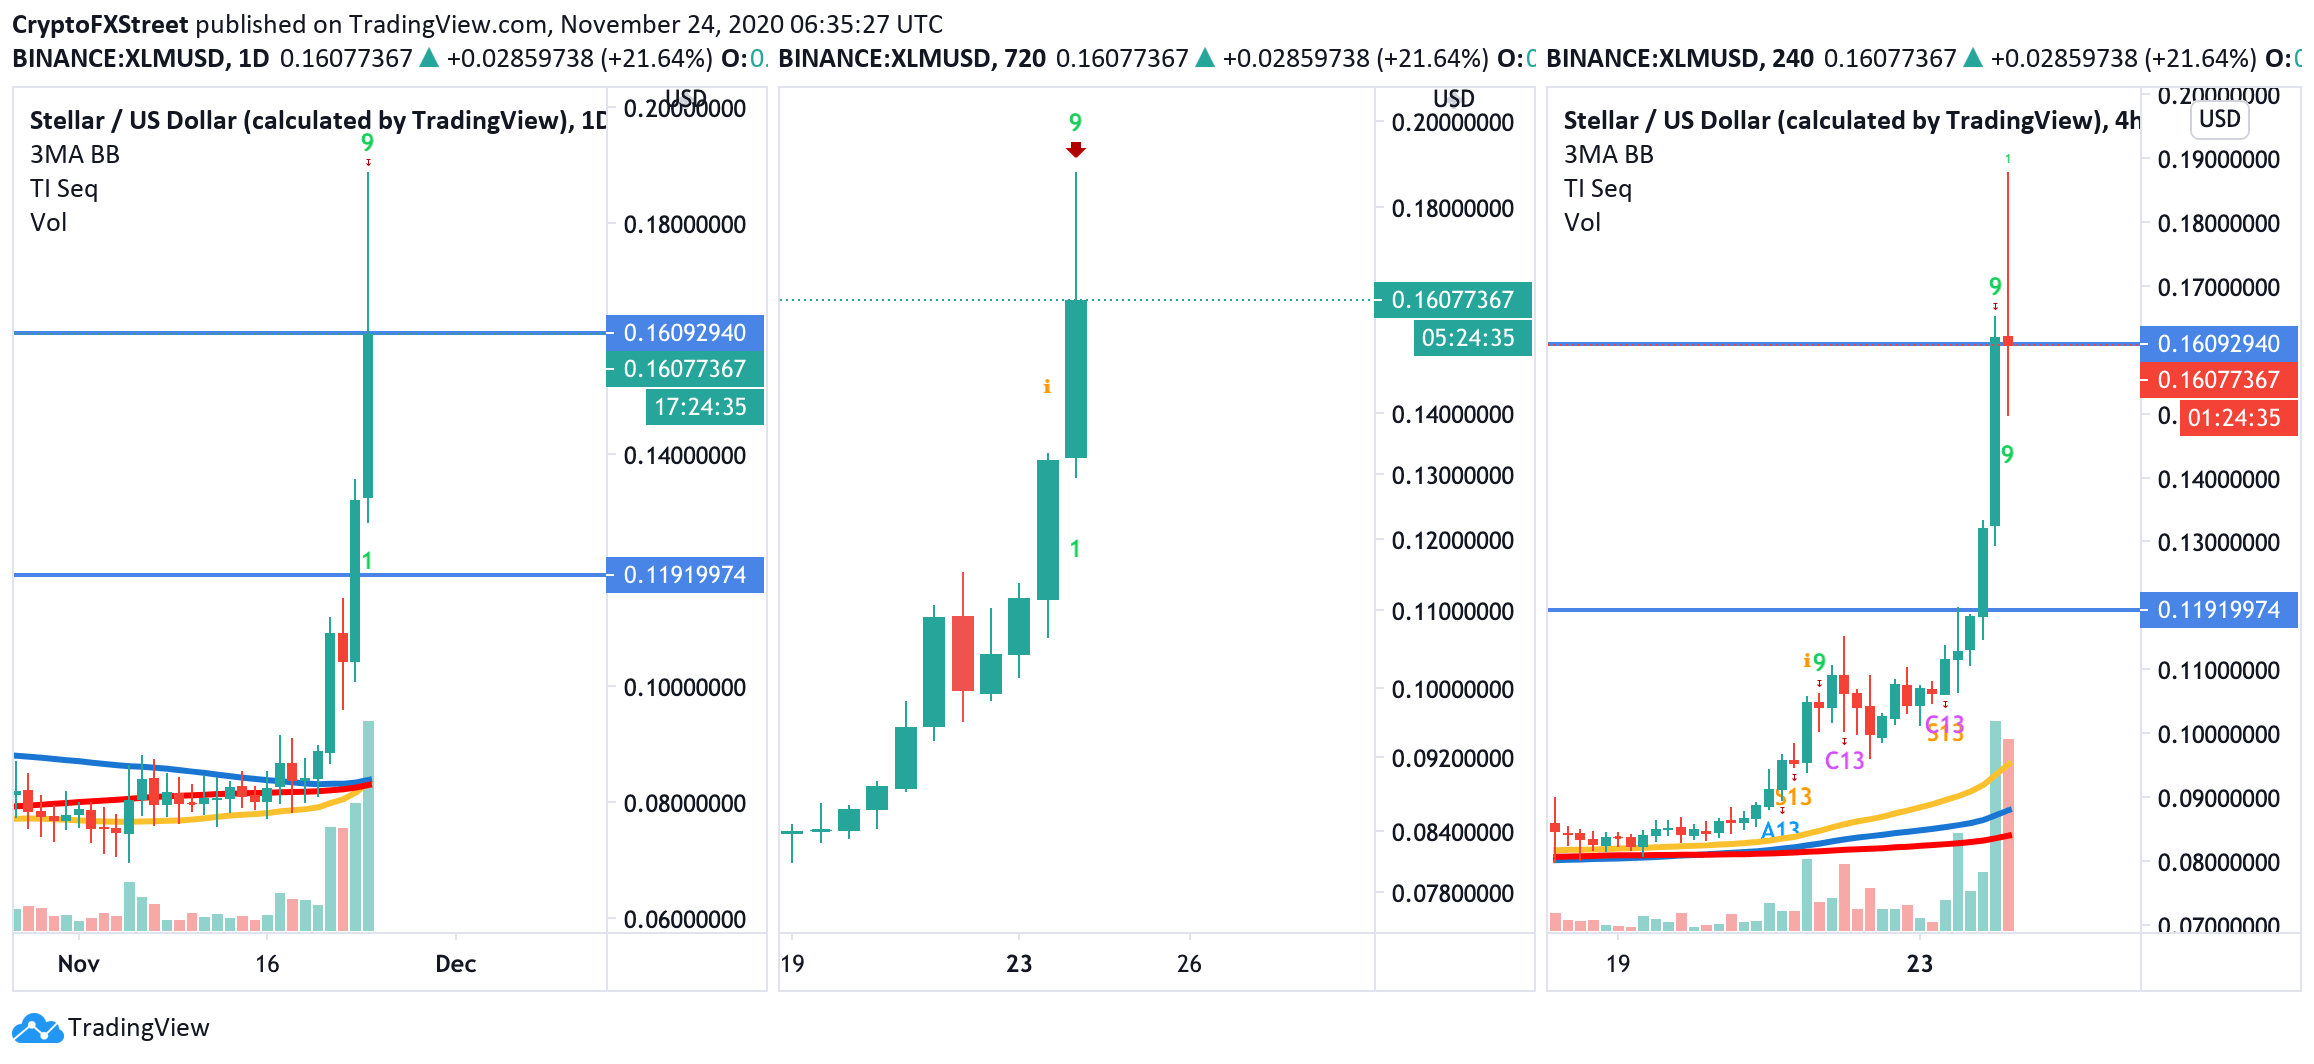
XLM/USD, TD Sequential indicator on multiple charts
On the long-term charts, the initial support is created by $0.16. This barrier was verified as resistance in May 2019, and now it may serve as a backstop for the downside move.
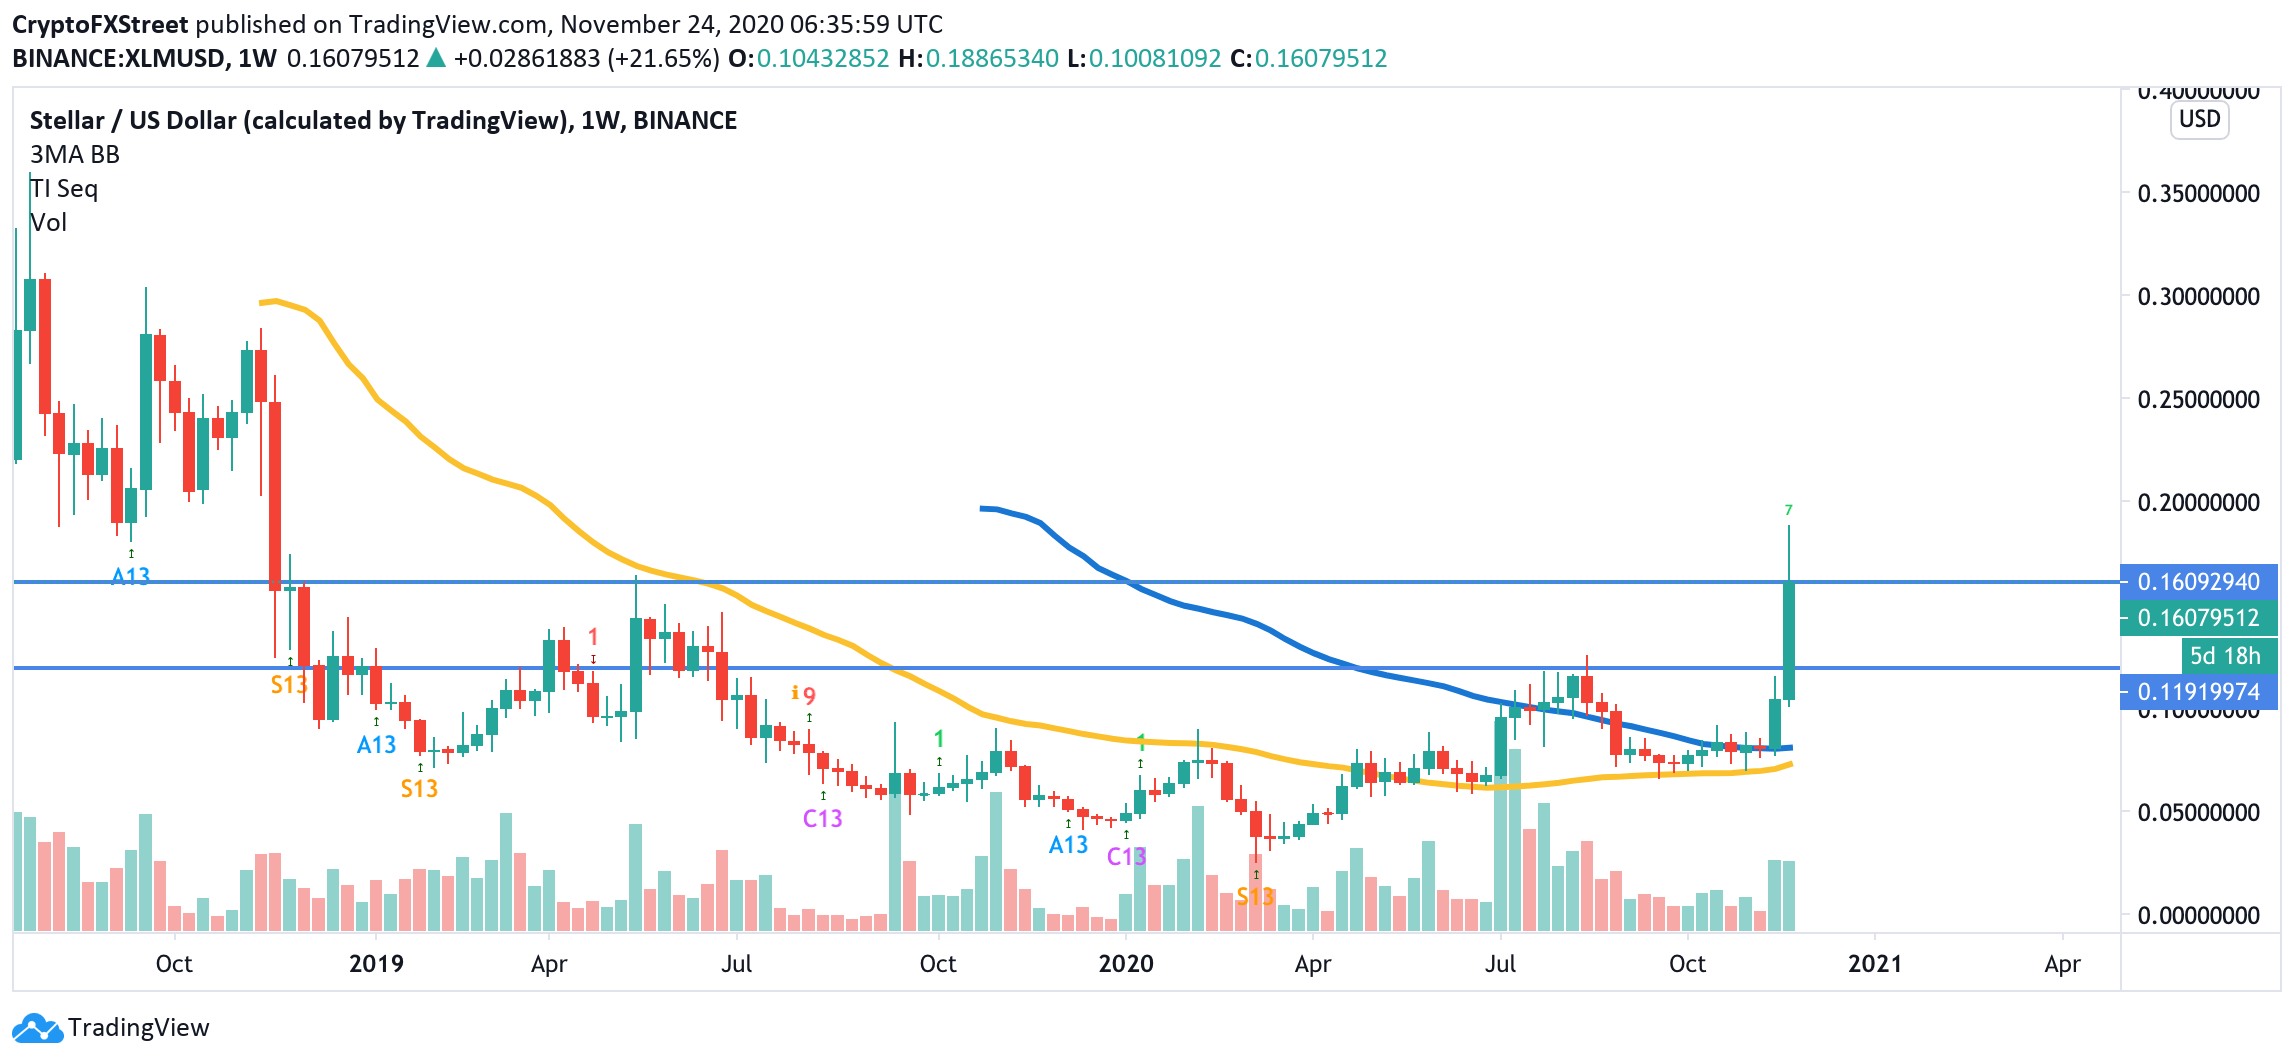
XLM/USD, weekly chart
If it is broken, the sell-off is likely to gain traction with the next focus on $0.12 that stopped the recovery attempts in August. A sustainable move below this area will invalidate the long-term bullish scenario and bring weekly EMA200 at $0.08 into focus.
Author

Tanya Abrosimova
Independent Analyst


