Stellar contemplates introducing AMMs as XLM price eyes retest of $0.303
- XLM price takes a breather as it prepares for a 15% upswing to $0.303.
- Stellar plans to introduce Automated Market Makers on its blockchain via Protocol 18 proposal.
- A breakdown of the $0.228 support level will invalidate the bullish outlook.

XLM price is consolidating in an uptrend after a sharp upswing ended on July 23. A pullback seems likely before the new leg-up begins. Therefore, investors can expect Stellar to retrace to crucial support levels.
Automated Market Maker on Stellar
Stellar announced on July 1 the introduction of Automated Market Makers (AMMs) as part of its 2021 roadmap. The main focus of this roadmap, especially in 2021, is to improve liquidity. Doing so will allow users on the Stellar network to access this liquidity to convert assets seamlessly and efficiently.
Since the Stellar Network helps transfers across borders, having liquidity that allows conversion of multiple currencies will be a vital ace to have up one’s sleeve.
However, things are pretty straightforward as they seem. Due to the decentralized nature of the network, the validators need to vote on the “Stellar Protocol 18” proposal that plans to implement AMMs. If the validators agree, they will have to upgrade to a newer version of the network.
The blog reads,
Protocol 18 will add automated market maker functionality to Stellar, enabling developers to create AMMs that will coexist alongside the SDEX and provide an alternate source of liquidity.
XLM price prepares for upswing
XLM price is getting rejected after failing to slice through the $0.303 resistance level. So far, Stellar has dropped 10% to where it currently stands, $0.273.
If the selling pressure continues to pour in, the immediate support barrier at $0.262 will shatter. The $0.251 demand barrier will likely serve as a foothold that reverses the downward trend. A resurgence of buying pressure at this level might trigger a 20% upswing that creates an equal high after retesting the $0.303 supply barrier.
Supporting this short-term pullback is the Momentum Reversal Indicator, which flashed a sell signal in the form of a red ‘one’ candlestick on the 6-hour chart. This technical formation forecasts a one-to-four candlestick correction, adding a tailwind to the downswing hypothesis.
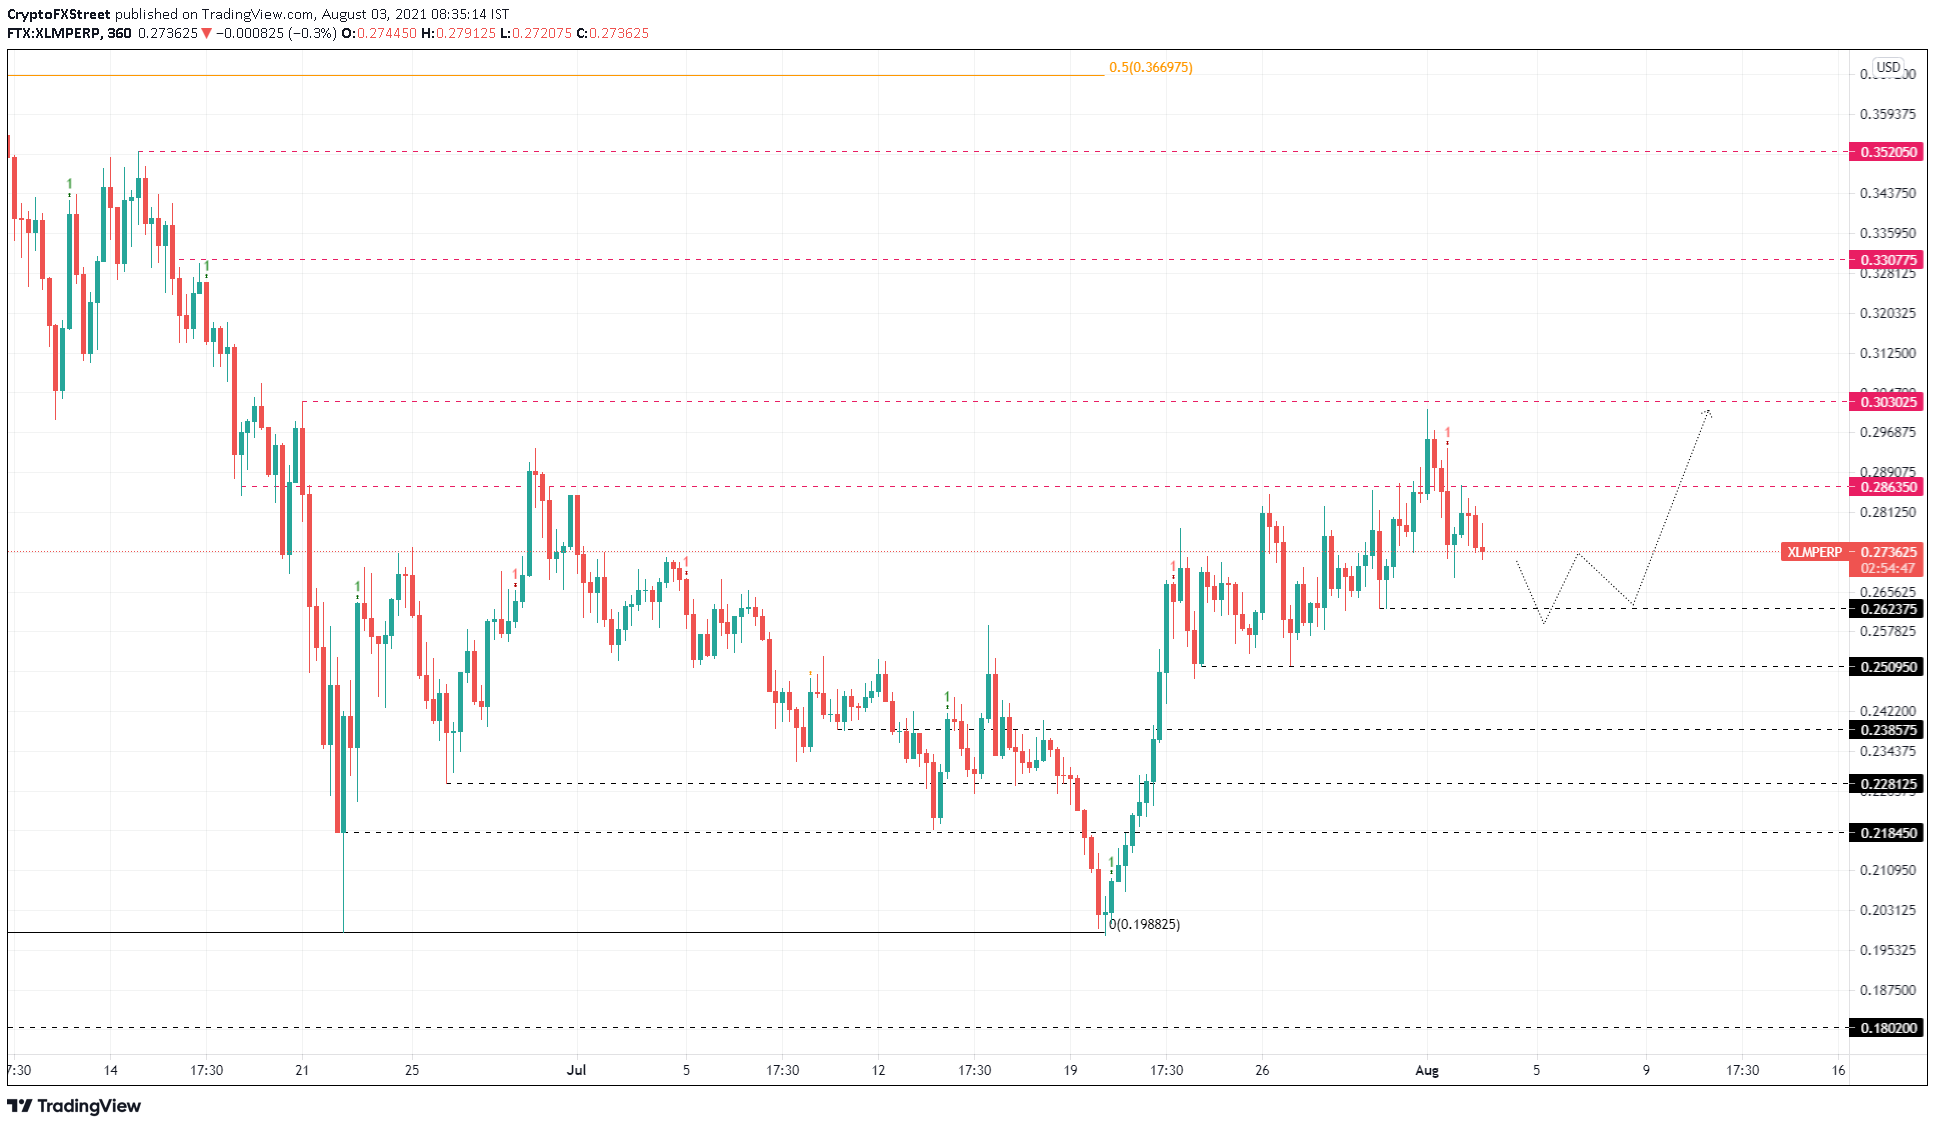
XLM/USDT 6-hour chart
While a reversal seems likely around $0.251, investors should keep an eye out for a breach of this barrier in a highly bearish case. If this were to occur, XLM price might kick-start the uptrend from $0.236.
However, a breakdown of the $0.228 foothold will invalidate the bullish thesis and trigger a sell-off to $0.218.
Author

Akash Girimath
FXStreet
Akash Girimath is a Mechanical Engineer interested in the chaos of the financial markets. Trying to make sense of this convoluted yet fascinating space, he switched his engineering job to become a crypto reporter and analyst.


