• Solana price sees bulls being rejected from further upside at $195. 
  • SOL price is taking a step back after rejection, but the bullish triangle is still active.
  • Expect the price to drift back to the blue ascending trend line before moving back on the front foot.

Solana (SOL) price is coming under some selling pressure as people make their way to the Christmas dinner table or do their last-minute shopping. As investors gently start to pull some funds out of their trades, some pullbacks in SOL price could be expected throughout the day to diminish risk going into the holiday season. Expect SOL price to look for ground support that could be present at the blue ascending trend line near $175.

Solana bulls look for support to start the holiday season

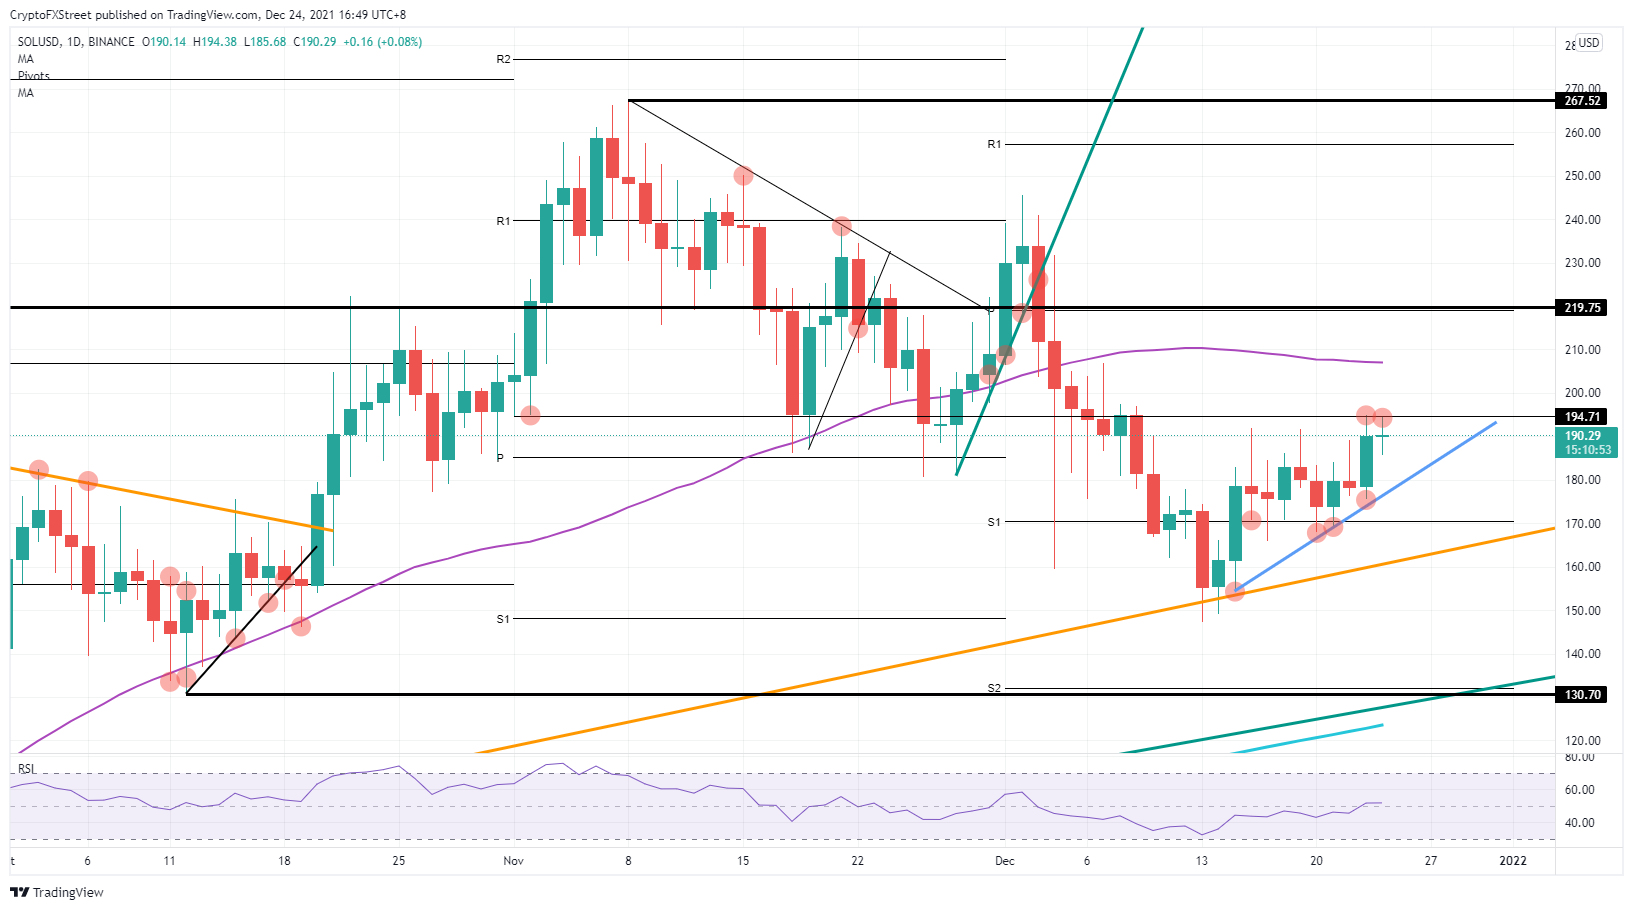
Solana price has been in a bullish triangle since December 15, with the blue diagonal trend line and the minor technical resistance at $195. With the blue trend line well respected and bulls joining the rally on repeated tests, expect to see a bullish breakout soon in the coming days. In the meantime, a preemptive test of $195 has seen rejection and could see further pulling back in SOL price towards the blue trend line for support. 

Going into Christmas evening, liquidity will start to die down, so expect to see price action come to a halt or some small sideways price action around $175. That level intersects with the blue ascending trend line intraday and would be an excellent level to hold with $195 still in view for a breakout. Expect the bullish setup to remain intact, therefore, but take a pause to enjoy the Christmas banquet before rebooting the rally with $220 as the next price target.

SOL/USD daily chart

XRP/USD daily chart

As already mentioned, liquidity will be thin and start to die down further into the evening, so any strange market movements can not be ruled out. It could easily be the case that some investors jump on this technical environment and run the price up in a squeeze with low liquidity. This could see an extended wick on the candle that reaches $220, as the rally is likely to be very short-lived and almost impossible to join when it happens or to try to short, as the move will probably unfold in a matter of seconds or a few minutes. This also goes for any downside moves towards $130 from a break below the blue and orange ascending trend line.


Information on these pages contains forward-looking statements that involve risks and uncertainties. Markets and instruments profiled on this page are for informational purposes only and should not in any way come across as a recommendation to buy or sell in these assets. You should do your own thorough research before making any investment decisions. FXStreet does not in any way guarantee that this information is free from mistakes, errors, or material misstatements. It also does not guarantee that this information is of a timely nature. Investing in Open Markets involves a great deal of risk, including the loss of all or a portion of your investment, as well as emotional distress. All risks, losses and costs associated with investing, including total loss of principal, are your responsibility. The views and opinions expressed in this article are those of the authors and do not necessarily reflect the official policy or position of FXStreet nor its advertisers. The author will not be held responsible for information that is found at the end of links posted on this page.

If not otherwise explicitly mentioned in the body of the article, at the time of writing, the author has no position in any stock mentioned in this article and no business relationship with any company mentioned. The author has not received compensation for writing this article, other than from FXStreet.

FXStreet and the author do not provide personalized recommendations. The author makes no representations as to the accuracy, completeness, or suitability of this information. FXStreet and the author will not be liable for any errors, omissions or any losses, injuries or damages arising from this information and its display or use. Errors and omissions excepted.

The author and FXStreet are not registered investment advisors and nothing in this article is intended to be investment advice.

Join Telegram

Recommended content


Recommended Content

Editors’ Picks

Celebrity meme coins controversy continues amid Pump.fun revenue dominance

Celebrity meme coins controversy continues amid Pump.fun revenue dominance

Pump.fun outperformed the Ethereum blockchain on Tuesday after raking in $1.99 million. Following this achievement, a meme coin based on actress Sydney Sweeney was the subject of controversy after its developers dumped their bags on investors.

More Meme Coins News

PEPE's on-chain metrics indicate potential rally after weeks of silence

PEPE's on-chain metrics indicate potential rally after weeks of silence

PEPE has struggled to see any significant price move after reaching an all-time high in May. Increased adoption rate and low MVRV ratio indicate a bullish run may be on the horizon. A single PEPE outflow from Binance worth $14.7 million gives credence to signs of bullish expectation.

More Pepe News

Ethereum has failed to overcome key resistance despite bullish sentiment surrounding ETH ETF

Ethereum has failed to overcome key resistance despite bullish sentiment surrounding ETH ETF

Ethereum (ETH) is down more than 1.4% on Tuesday following another ETH sale from the Ethereum Foundation. Meanwhile, crypto exchange Gemini's recent report reveals that ETH ETF could see about $5 billion in net inflows within six months of launch.

More Ethereum News

Crypto community blasts Polkadot following report of treasury spending

Crypto community blasts Polkadot following report of treasury spending

Polkadot reports $87 million of treasury spending during H1. Crypto community members expressed harsh feelings toward the DOT team's high spending. DOT is up more than 2% in the past 24 hours but risks correction following the report.

More Polkadot News

Bitcoin: BTC price correction could end in July, according to seasonal data

Bitcoin: BTC price correction could end in July, according to seasonal data

Bitcoin (BTC) price appears poised for a decline this week, influenced by slight outflows in US spot ETFs, selling activity among BTC miners, and a combined transfer of 4,690.28 BTC to centralized exchanges by the US and German governments.

Read full analysis

BTC

ETH

XRP