- Solana price sees continuing buying alongside the current uptrend line.
- SOL bulls face no real resistance before hitting all-time highs.
- Current headwinds could slow down the uptrend, and a break below the trend line a buy-the-dip response.
Solana (SOL) price is in a firm uptrend with bulls holding to a green ascending trend line for support as green candles march higher. . At this pace, SOL price should make new all-time highs by next week at around $300. The only element that could slow down the trend are Covid headwinds and global market turmoil, but even these do not look strong enough to really halt the uptrend.
Solana bulls target $300 as the ultimate profit target
Solana price sees a steady and solid rally with consecutive trading days making new highs.. Although the Relative Strength Index (RSI) is soaring towards the overbought area, there is still plenty of upside left over and the steepness of the rally is relatively mild. Therefore,bulls can add to daily positions and book gains without the trend losing steam.
SOL price is expected to hit an all-time high around next week. A squeeze is likely against the existing all-time high at $267.52 that will act as a baseline. The ascending trend line will then provide the tilted side of a bullish triangle. A breakout through the base will see accelerated buying and a quick spike up towards $300. Once there, expect a slight fade in the rally as the RSI will by then be overbought and likely lead investors to cash in some gains.
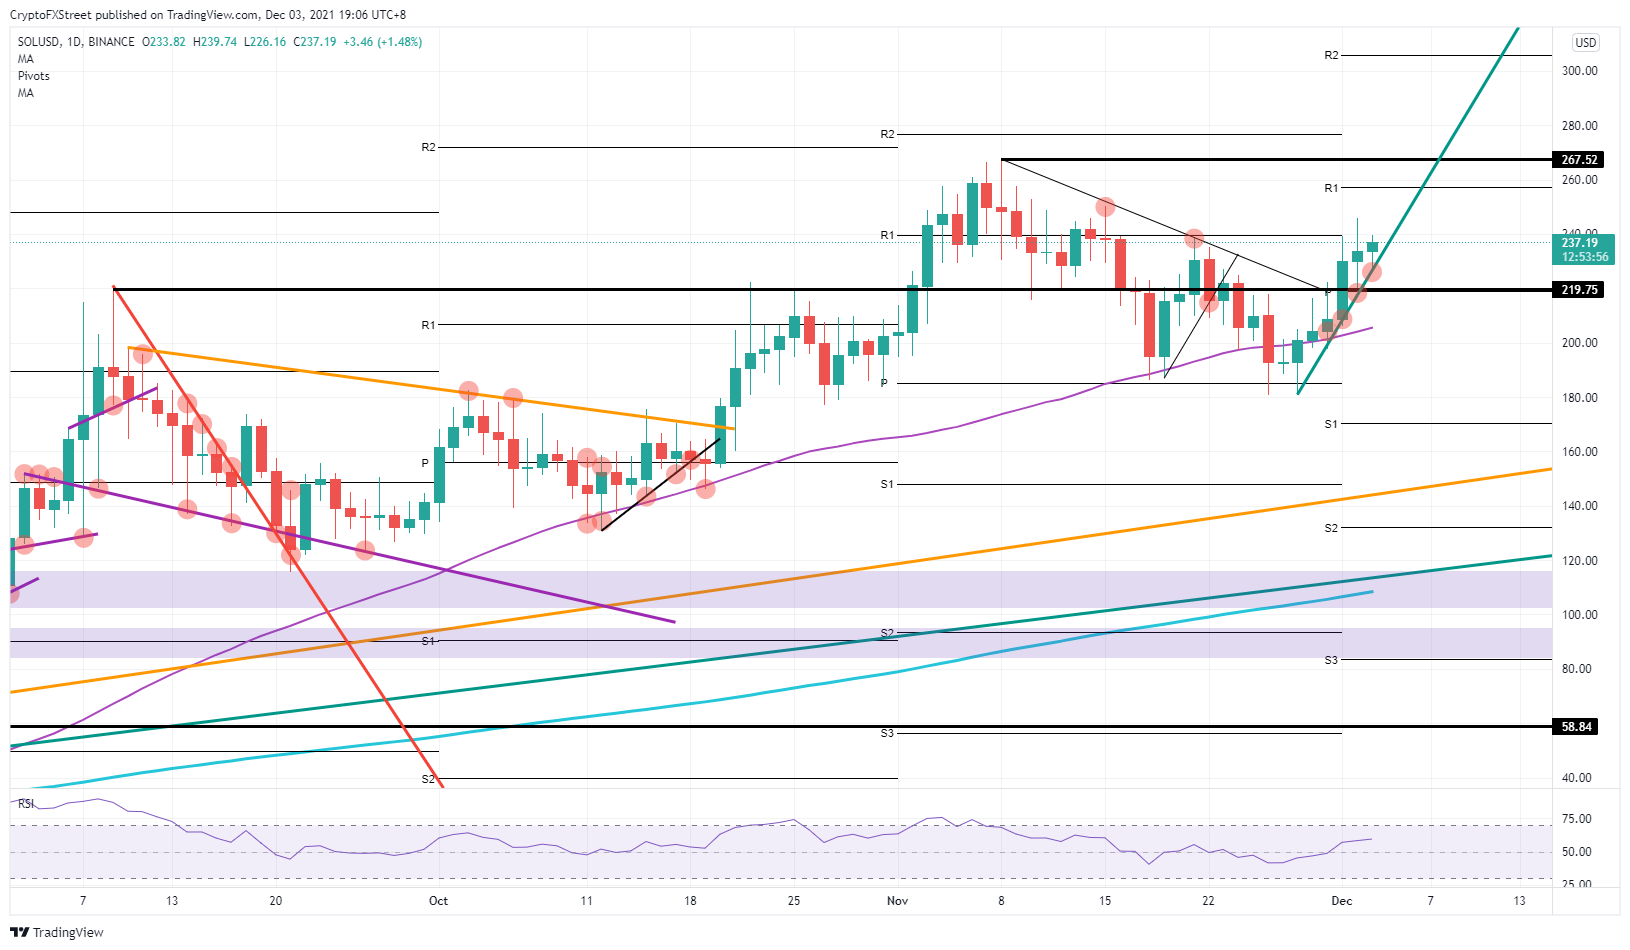
SOL/USD daily chart
Should the green ascending trend line break, however, expect a quick return towards $219.75, which is likely to provide a first line of defense where bulls will want to try and keep the uptrend intact. Should headwinds start to further weigh, expect a short break and pickup in SOL price action again at the 55-day Simple Moving Average (SMA), at $206. Even the psychological $200 level would be an additional factor that could likely limit any further correction, giving bulls three good reasons and entry points to buy the dip before recovering and driving higher to new all-time highs at $300.
Information on these pages contains forward-looking statements that involve risks and uncertainties. Markets and instruments profiled on this page are for informational purposes only and should not in any way come across as a recommendation to buy or sell in these assets. You should do your own thorough research before making any investment decisions. FXStreet does not in any way guarantee that this information is free from mistakes, errors, or material misstatements. It also does not guarantee that this information is of a timely nature. Investing in Open Markets involves a great deal of risk, including the loss of all or a portion of your investment, as well as emotional distress. All risks, losses and costs associated with investing, including total loss of principal, are your responsibility. The views and opinions expressed in this article are those of the authors and do not necessarily reflect the official policy or position of FXStreet nor its advertisers. The author will not be held responsible for information that is found at the end of links posted on this page.
If not otherwise explicitly mentioned in the body of the article, at the time of writing, the author has no position in any stock mentioned in this article and no business relationship with any company mentioned. The author has not received compensation for writing this article, other than from FXStreet.
FXStreet and the author do not provide personalized recommendations. The author makes no representations as to the accuracy, completeness, or suitability of this information. FXStreet and the author will not be liable for any errors, omissions or any losses, injuries or damages arising from this information and its display or use. Errors and omissions excepted.
The author and FXStreet are not registered investment advisors and nothing in this article is intended to be investment advice.
Recommended Content
Editors’ Picks
Shiba Inu Price Forecast: SHIB holders unload 61.5 billion tokens in the last ten days
Shiba Inu (SHIB) price is hovering around $0.000013 on Tuesday after dropping nearly 12% the previous day. Supply Distribution data shows that whale wallets have decreased SHIB holdings in the last ten days.
XRP eyes further downside as Trump to implement tariffs on Mexico, Canada, in March
Ripple's XRP joined the wider crypto market decline, plunging nearly 10% on Monday following President Donald Trump reiterating that the US will kick off tariffs on Mexico and Canada.
Raydium drops 35% on speculation of PumpFun’s Automated Market Maker development
Raydium (RAY) price trades around $3 on Tuesday after dropping almost 35% the previous day. This price crash was due to the rumors of a competing Automated Market Maker being developed by PumpFun and losing $334 million in market capitalization
Crypto Today: USDC approved in Dubai, SOL, ETH and BTC in turmoil, as Trump tariffs spark $200B losses
Cryptocurrency markets declined 7% on Monday, as cascading $208 billion liquidations shaved $80 billion off the sector’s aggregate valuation.
Bitcoin: BTC demand and liquidity conditions remain weak
Bitcoin price has been consolidating between $94,000 and $100,000 since early February, hovering around $98,000 at the time of writing on Friday. Despite this consolidation, US Bitcoin spot ETFs data recorded a total net outflow of $489.60 million until Thursday, hinting signs of weakness among institutional investors.
The Best brokers to trade EUR/USD
SPONSORED Discover the top brokers for trading EUR/USD in 2025. Our list features brokers with competitive spreads, fast execution, and powerful platforms. Whether you're a beginner or an expert, find the right partner to navigate the dynamic Forex market.