- Solana price lost 65% of its market value in November.
- Binance Exchange's API shows the largest volume trading day during the SOL price decline.
- A break above $14 could trigger a spike into the $17 price zone.
Solana price was a crypto-underperformer throughout November. While several cryptocurrencies produced decent-to-jaw-dropping countertrend rallies, the Solana price remained suppressed. As the SOL price hovers 20% above the newly established yearly low at $10.94, the technicals suggest the centralized smart-contract token could fall further.
Solana price faces repression
Solana price is currently auctioning at $13.54. The bulls have failed on three separate occasions in November to hurdle above the $14 zone. A Fibonacci retracement tool surrounding the 65% decline shows the $14 zone as just a 23.6% retracement. Amongst Fibonacci swing traders, the aforementioned level is not considered a strong confluence zone. In other words, the 23.6% level is usually breached as most Fib practitioners consider the 38.2%, 50% and 61.8% levels as magnet-like targets.
Only in hindsight of a sell-off can bearish strength be transparent. Still, Solana's failure to hurdle the unpopular resistant zone may provide context and justification for the bullish repression.
The volume indicator adds further clues as the initial 3-day bearish engulfing candle that brought SOL into the current price zone shows the largest amount of transactions occurring since Solana's inception. According to Binance's exchange API, 83.196 million dollars worth of Solana tokens were transacted during the 3-day plummet between November 7 and November 9.
Since only smart money market makers can produce such massive numbers in volume, the influx may be interpreted as extreme bearish confidence in the current downtrend from high-cap investors.
Based on the technicals' the SOL price decline is likely undone. The bear's next target would be the 2020 liquidity zone at $10 and potentially $7, creating up to a 48% decline from SOL's current market value.
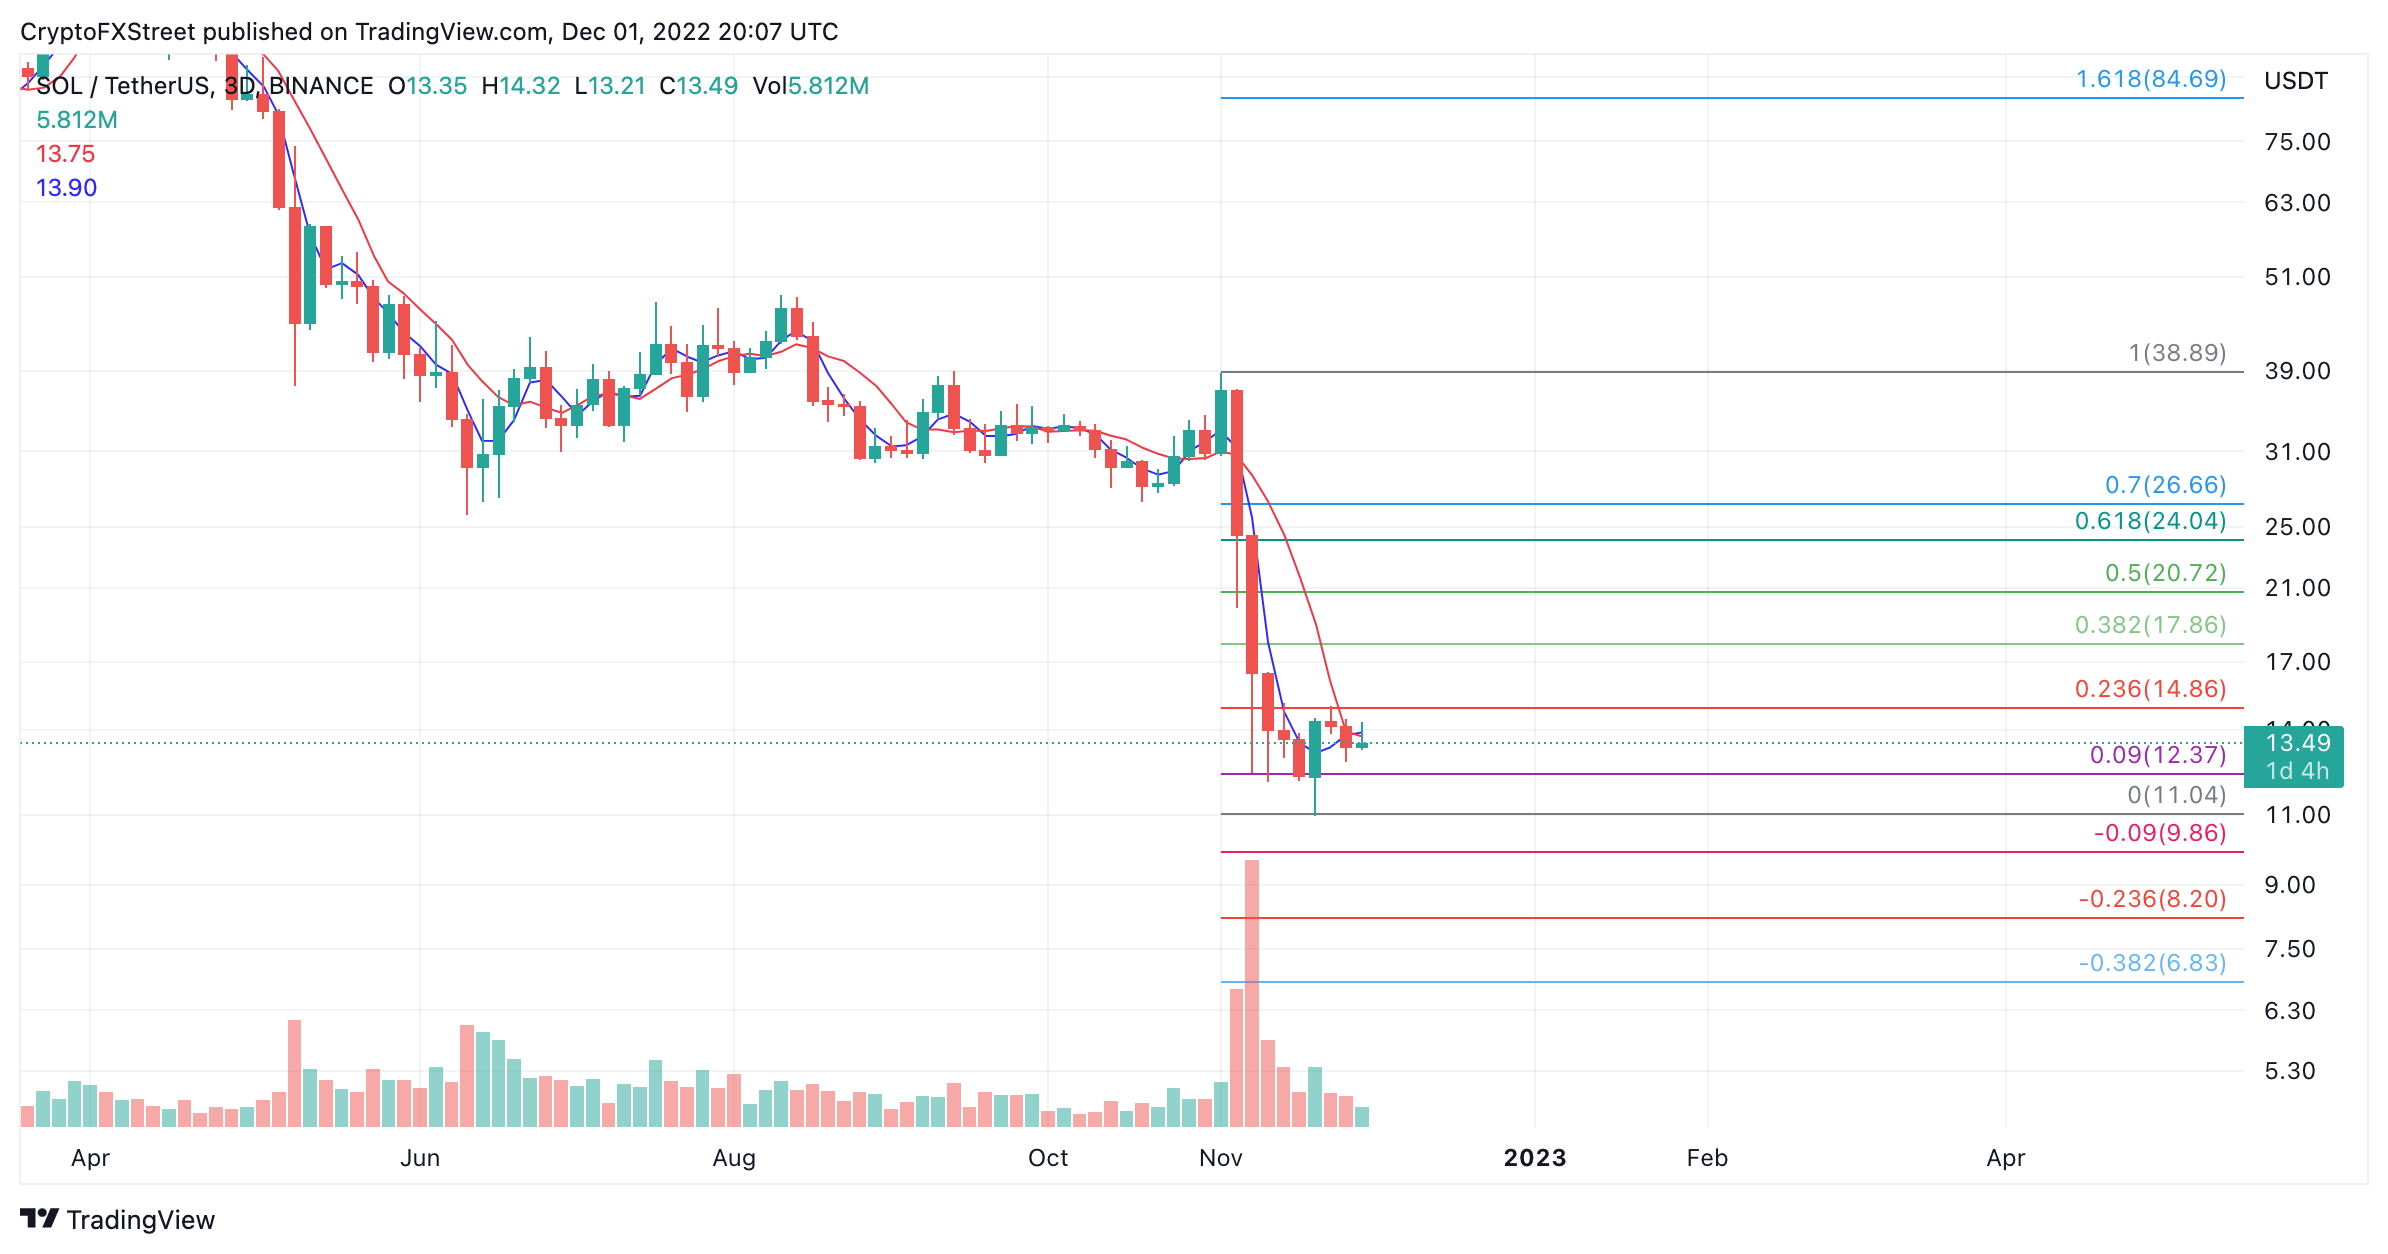
SOL USDT 3-day chart
The bulls will need to challenge the candlestick that brought the SOL price into the current range to invalidate its bearish potential. A breach of the candle's closing price at $16.45 would create further opportunities for the bulls to climb higher. Potential targets would be the 38.2% and 50% Fib levels at $17.86 and $20.72. The sol price would rise up to 56% if the levels were breached.
Information on these pages contains forward-looking statements that involve risks and uncertainties. Markets and instruments profiled on this page are for informational purposes only and should not in any way come across as a recommendation to buy or sell in these assets. You should do your own thorough research before making any investment decisions. FXStreet does not in any way guarantee that this information is free from mistakes, errors, or material misstatements. It also does not guarantee that this information is of a timely nature. Investing in Open Markets involves a great deal of risk, including the loss of all or a portion of your investment, as well as emotional distress. All risks, losses and costs associated with investing, including total loss of principal, are your responsibility. The views and opinions expressed in this article are those of the authors and do not necessarily reflect the official policy or position of FXStreet nor its advertisers. The author will not be held responsible for information that is found at the end of links posted on this page.
If not otherwise explicitly mentioned in the body of the article, at the time of writing, the author has no position in any stock mentioned in this article and no business relationship with any company mentioned. The author has not received compensation for writing this article, other than from FXStreet.
FXStreet and the author do not provide personalized recommendations. The author makes no representations as to the accuracy, completeness, or suitability of this information. FXStreet and the author will not be liable for any errors, omissions or any losses, injuries or damages arising from this information and its display or use. Errors and omissions excepted.
The author and FXStreet are not registered investment advisors and nothing in this article is intended to be investment advice.
Recommended Content
Editors’ Picks

IRS says crypto staking should be taxed in response to lawsuit
The IRS stated that rewards from cryptocurrency staking are taxable upon receipt, according to a Bloomberg report on Monday, which stated the agency rejected a legal argument that sought to delay taxation until such rewards are sold or exchanged.
Solana dominates Bitcoin, Ethereum in price performance and trading volume: Glassnode
Solana is up 6% on Monday following a Glassnode report indicating that SOL has seen more capital increase than Bitcoin and Ethereum. Despite the large gains suggesting a relatively heated market, SOL could still stretch its growth before establishing a top for the cycle.
Ethereum Price Forecast: ETH risks a decline to $3,000 as investors realize increased profits and losses
Ethereum is up 4% on Monday despite increased selling pressure across long-term and short-term holders in the past two days. If whales fail to maintain their recent buy-the-dip attitude, ETH risks a decline below $3,000.

Crypto Today: BTC hits new Trump-era low as Chainlink, HBAR and AAVE lead market recovery
The global cryptocurrency market cap shrank by $500 billion after the Federal Reserve's hawkish statements on December 17. Amid the market crash, Bitcoin price declined 7.2% last week, recording its first weekly timeframe loss since Donald Trump’s re-election.

Bitcoin: 2025 outlook brightens on expectations of US pro-crypto policy
Bitcoin price has surged more than 140% in 2024, reaching the $100K milestone in early December. The rally was driven by the launch of Bitcoin Spot ETFs in January and the reduced supply following the fourth halving event in April.

Best Forex Brokers with Low Spreads
VERIFIED Low spreads are crucial for reducing trading costs. Explore top Forex brokers offering competitive spreads and high leverage. Compare options for EUR/USD, GBP/USD, USD/JPY, and Gold.