• Solana price action is on a downward trajectory.
  • SOL bulls are trying to turn the tide with an imminent break of the descending trend.
  • A break higher opens up a 36% potential upside for buyers.

Solana (SOL) has been caught in a correction since September 9. Bears have been in control for the past few days, but bulls have taken over as price action in Solana has rebounded off a pattern trend line that was the main driver for the bullish run that lasted for almost a month.

Solana price is turning in favor of the bulls who can break the dictating descending trend line

Solana price action is consolidating for the second day now. SOL price is getting pushed against the R1 monthly resistance level at $148.91. That the resistance level holds importance has been proven at the beginning of September. First, it did its job as resistance, but after a clear break to the upside it got turned into support and has been doing that since September 7. Although it got broken on the rapid move on September 14, it still looks to have some importance short term. With the lower highs and the R1 holding, a descending triangle looks to be formed for now.

Although this element would sound like a favor for the SOL bears, it is instead a signal that bulls are ready to charge in full force. On September 14, buyers jumped in on the opportunity to go long at the purple tilted trend line. That line acted as a launch platform for the leg higher in Solana at the beginning of September. A  closer look at the chart will show that this setup was repeated before and after, with each time new highs in Solana prices.
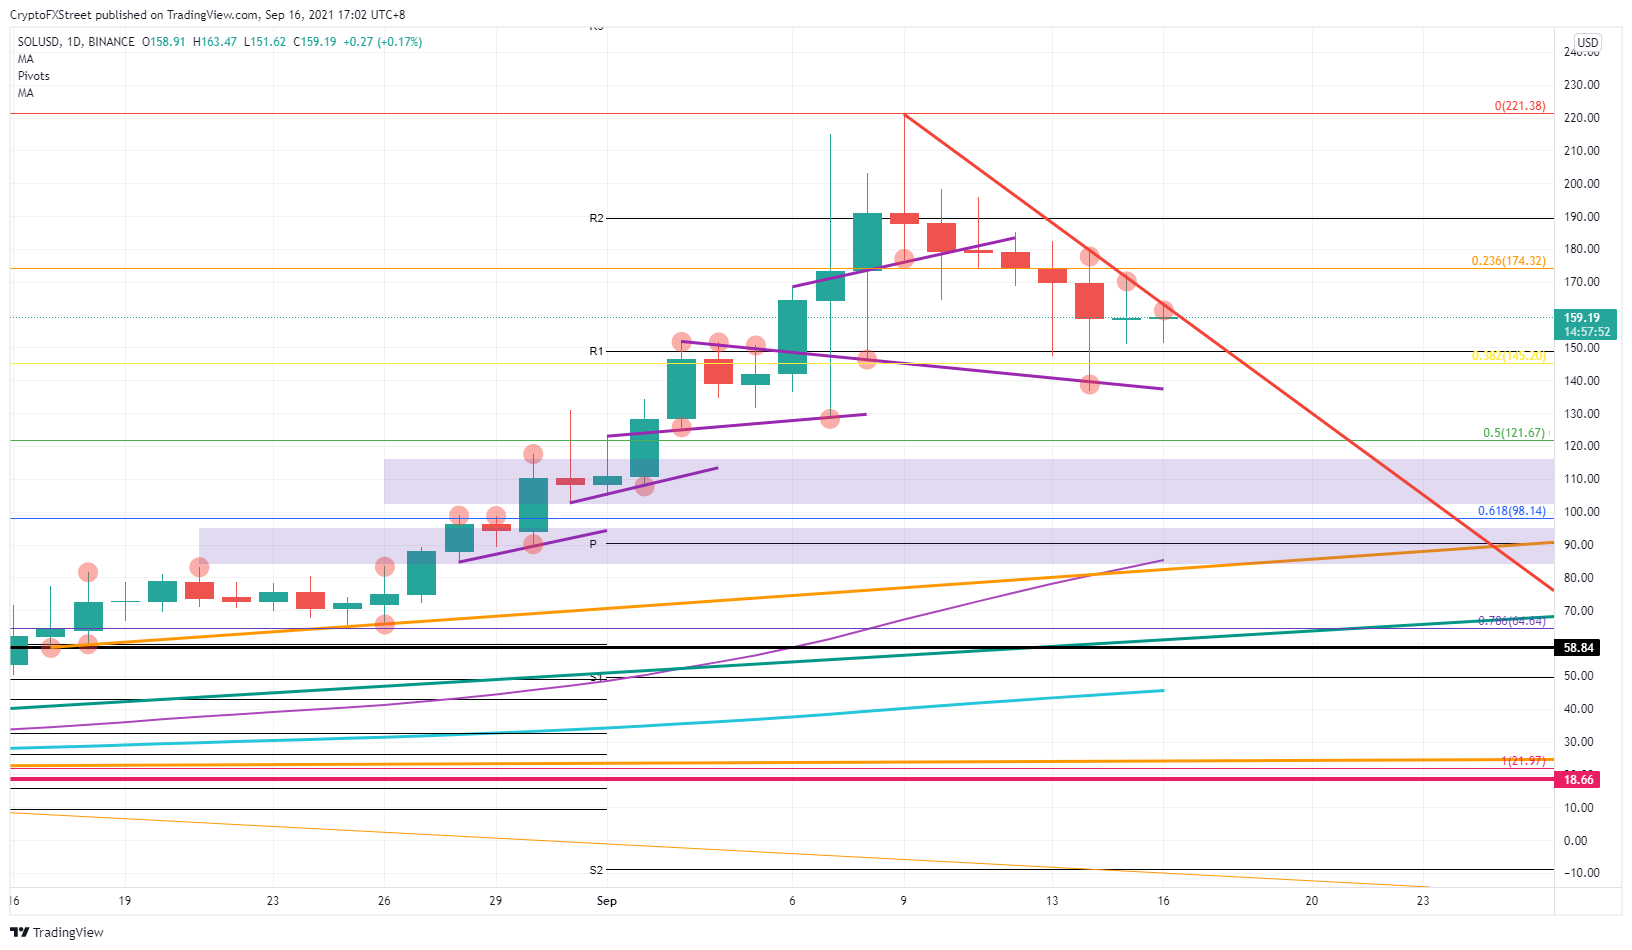
SOL/USD daily chart

SOL/USD daily chart

The red descending trend line is under attack with buyers present, with already two heavy attacks in the past two days. If buyers can push through, another pack of buyers waiting on the sideline will step in and provide the necessary fuel to ramp price action back up. A retest of $221.38 looks to be the only real target for Solana then, which would serve as a 36% profit target.

Bears will try to defend the red descending trend line. If they succeed in that, expect a break lower through the triangle's base with a retest again of the purple tilted trend line. When that does not hold as well, near $140, expect a retrace to the 50% Fibonacci level at $121.67.


Information on these pages contains forward-looking statements that involve risks and uncertainties. Markets and instruments profiled on this page are for informational purposes only and should not in any way come across as a recommendation to buy or sell in these assets. You should do your own thorough research before making any investment decisions. FXStreet does not in any way guarantee that this information is free from mistakes, errors, or material misstatements. It also does not guarantee that this information is of a timely nature. Investing in Open Markets involves a great deal of risk, including the loss of all or a portion of your investment, as well as emotional distress. All risks, losses and costs associated with investing, including total loss of principal, are your responsibility. The views and opinions expressed in this article are those of the authors and do not necessarily reflect the official policy or position of FXStreet nor its advertisers. The author will not be held responsible for information that is found at the end of links posted on this page.

If not otherwise explicitly mentioned in the body of the article, at the time of writing, the author has no position in any stock mentioned in this article and no business relationship with any company mentioned. The author has not received compensation for writing this article, other than from FXStreet.

FXStreet and the author do not provide personalized recommendations. The author makes no representations as to the accuracy, completeness, or suitability of this information. FXStreet and the author will not be liable for any errors, omissions or any losses, injuries or damages arising from this information and its display or use. Errors and omissions excepted.

The author and FXStreet are not registered investment advisors and nothing in this article is intended to be investment advice.

Join Telegram

Recommended content


Recommended Content

Editors’ Picks

Ripple on-chain metrics show bullish signs amidst legal struggle with SEC, XRP eyes recovery

Ripple on-chain metrics show bullish signs amidst legal struggle with SEC, XRP eyes recovery

Ripple made a comeback above $0.48 on Tuesday and hovers above that level in Wednesday’s European session. Ripple on-chain metrics such as transaction volume and Network Realized Profit/Loss have turned bullish, supporting a recovery in the altcoin. 

More Ripple News

Bitcoin price falls amidst German government transfers, miners activity

Bitcoin price falls amidst German government transfers, miners activity

Bitcoin (BTC) extends correction on Wednesday and hovers around $61,000 after finding resistance near the $64,000 level on Monday. Recent on-chain data indicates heightened selling activity from Bitcoin miners early in the week. 

More Bitcoin News

Crypto Today: Bitcoin erases gains from end of June, Ethereum declines while Ripple holds

Crypto Today: Bitcoin erases gains from end of June, Ethereum declines while Ripple holds

Bitcoin wipes out gains from the last week of June and falls below $60,000 on Wednesday. Ethereum and top altcoins ranked by market capitalization erased gains as the inflation outlook worsened. Ripple holds on to recent gains and hovers above $0.48 on Wednesday. 

More Cryptocurrencies News

Three reasons why altcoins could shake off losses this week

Three reasons why altcoins could shake off losses this week

On-chain data from Santiment shows that altcoins are currently in the opportunity zone, or generating buy signals. The top three altcoins in the buy zone are Basic Attention Token (BAT), Chromia (CHR), and Highstreet (HIGH), per Santiment. 

More Altcoins News

Bitcoin: BTC price correction could end in July, according to seasonal data

Bitcoin: BTC price correction could end in July, according to seasonal data

Bitcoin (BTC) price appears poised for a decline this week, influenced by slight outflows in US spot ETFs, selling activity among BTC miners, and a combined transfer of 4,690.28 BTC to centralized exchanges by the US and German governments.

Read full analysis

BTC

ETH

XRP