- Solana price trades within a pattern from which a breakout is expected.
- Despite a bullish price action, the technical formation hints at an incoming reversal to $15.19 for SOL.
- This bearish outlook will be invalidated after a daily candlestick close above the chart pattern's upper boundary at $26.74.
Solana (SOL) price is trading with a bullish bias on the daily and lower timeframes, printing green candlesticks that could be misleading to the naked eye. However, a closer look at the price action suggests an incoming reversal with a governing technical formation that suggests the same.
Also Read: Solana Metaplex fees could push developers back to Ethereum
Solana price prepares for a possible 20% reversal
Solana (SOL) price is up 10% in the last four days as bulls lead the market with four consecutive green candlesticks to record an intra-day high of $20.79 on May 28 as of press time. At the time of writing, the Ethereum killer is auctioning at $20.47, a daily rise of 5%. With this bullish outlook, however, the price action hints at a possible reversal as it consolidates within a rising or ascending wedge pattern.
The ascending wedge pattern forms when an asset's price action moves between two upward-sloping, converging trendlines. The narrowing wedge shape is created as the price action oscillates between the support and resistance trendlines, ultimately converging at the apex.
The support trendline is drawn by connecting a series of higher lows, while the resistance trendline is drawn by connecting a series of lower highs. As the trendlines converge, they create an upward-sloping wedge shape. The pattern's breakout occurs when the price action breaches either the support or the resistance trendline, signaling a potential reversal or continuation of the current trend.
Often, this technical formation proves bearish, and Solana price could break below the support trendline. An increase in buyer momentum could see Solana price ascend further, potentially flipping the resistances due to the $100- and 50-day Simple Moving Averages (SMA) at $21.48 and $21.65, respectively, before targeting the upper boundary of the chart at $25.67.
However, Solana price would have to break above the $26.74 resistance level to invalidate the bearish thesis. Conservative investors should wait for confirmation above this level for long positions.
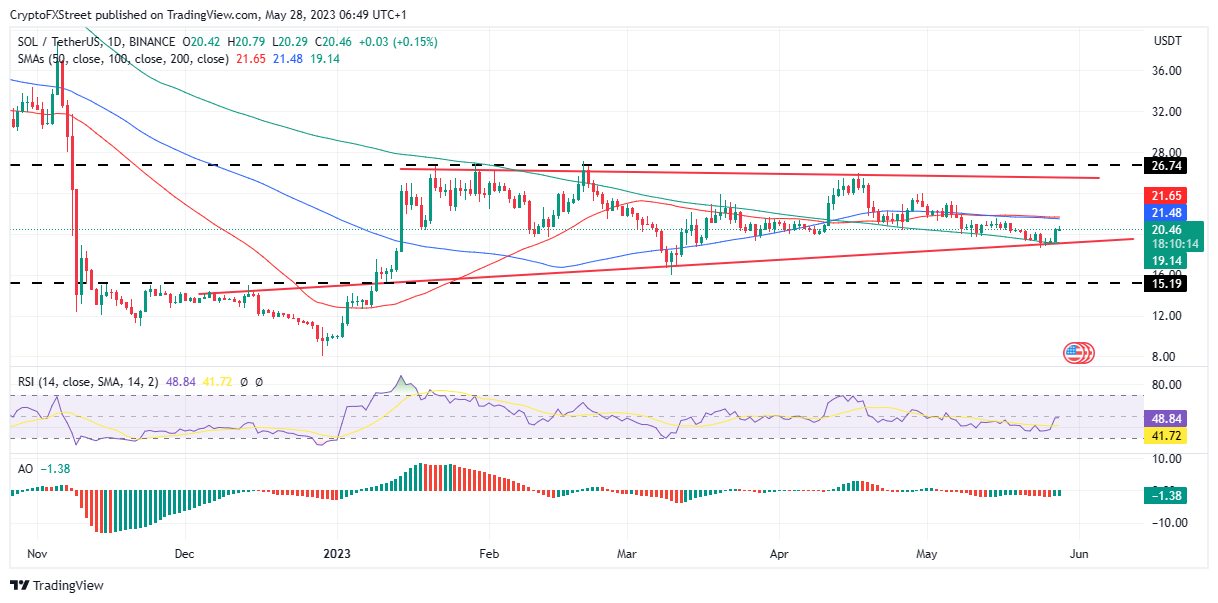
SOL/USDT 1-day chart
Otherwise, Solana price lacks sufficient momentum to sustain the uptrend and could reverse soon. In such a case, SOL could break below the lower boundary of the rising wedge or extend lower to tag the $15.19 support level in the dire case. Such a move would denote a 25% downswing from the current level.
To support this postulation, the Relative Strength Index (RSI) was still below the midline, deflecting, suggesting a repulsion. Moreover, the Awesome Oscillators (AO) were also in the negative zone, suggesting bears dominated the SOL market.
Also Read: Hong Kong leaves the door open to Ethereum killers Cardano, Solana, AVAX, MATIC and LINK
Information on these pages contains forward-looking statements that involve risks and uncertainties. Markets and instruments profiled on this page are for informational purposes only and should not in any way come across as a recommendation to buy or sell in these assets. You should do your own thorough research before making any investment decisions. FXStreet does not in any way guarantee that this information is free from mistakes, errors, or material misstatements. It also does not guarantee that this information is of a timely nature. Investing in Open Markets involves a great deal of risk, including the loss of all or a portion of your investment, as well as emotional distress. All risks, losses and costs associated with investing, including total loss of principal, are your responsibility. The views and opinions expressed in this article are those of the authors and do not necessarily reflect the official policy or position of FXStreet nor its advertisers. The author will not be held responsible for information that is found at the end of links posted on this page.
If not otherwise explicitly mentioned in the body of the article, at the time of writing, the author has no position in any stock mentioned in this article and no business relationship with any company mentioned. The author has not received compensation for writing this article, other than from FXStreet.
FXStreet and the author do not provide personalized recommendations. The author makes no representations as to the accuracy, completeness, or suitability of this information. FXStreet and the author will not be liable for any errors, omissions or any losses, injuries or damages arising from this information and its display or use. Errors and omissions excepted.
The author and FXStreet are not registered investment advisors and nothing in this article is intended to be investment advice.
Recommended Content
Editors’ Picks

Shiba Inu eyes positive returns in April as SHIB price inches towards $0.000015
Shiba Inu's on-chain metrics reveal robust adoption, as addresses with balances surge to 1.4 million. Shiba Inu's returns stand at a solid 14.4% so far in April, poised to snap a three-month bearish trend from earlier this year.

AI tokens TAO, FET, AI16Z surge despite NVIDIA excluding crypto-related projects from its Inception program
AI tokens, including Bittensor and Artificial Superintelligence Alliance, climbed this week, with ai16z still extending gains at the time of writing on Friday. The uptick in prices of AI tokens reflects a broader bullish sentiment across the cryptocurrency market.

Bitcoin Weekly Forecast: BTC consolidates after posting over 10% weekly surge
Bitcoin price is consolidating around $94,000 at the time of writing on Friday, holding onto the recent 10% increase seen earlier this week. This week’s rally was supported by strong institutional demand, as US spot ETFs recorded a total inflow of $2.68 billion until Thursday.

XRP price could renew 25% breakout bid on surging institutional and retail adoption
Ripple price consolidates, trading at $2.18 at the time of writing on Friday, following mid-week gains to $2.30. The rejection from this weekly high led to the price of XRP dropping to the previous day’s low at $2.11, followed by a minor reversal.
Bitcoin Weekly Forecast: BTC consolidates after posting over 10% weekly surge
Bitcoin (BTC) price is consolidating around $94,000 at the time of writing on Friday, holding onto the recent 10% increase seen earlier this week.

The Best brokers to trade EUR/USD
SPONSORED Discover the top brokers for trading EUR/USD in 2025. Our list features brokers with competitive spreads, fast execution, and powerful platforms. Whether you're a beginner or an expert, find the right partner to navigate the dynamic Forex market.