- Solana price could undergo a minor retracement as the MRI warms of an impending sell signal.
- In some cases, SOL could retest the $216.9 support floor before kick-starting an 88% ascent to $407.
- A daily close below $204 will invalidate the bullish thesis.
Solana price looks suspended after breaching a crucial hurdle, suggesting indecision among buyers. An eventual resolution of this condition will likely result in SOL exploding to new highs.
Solana price awaits directional bias
Solana price set up three equal highs at $216 resistance barrier between September 9 and November 2. Between these swing points, SOL also created two distinctive swing lows, one higher than the other, resulting in the formation of a cup-and-handle pattern.
This technical formation forecasts an 88% ascent to $407, obtained by adding the distance between the first swing high and swing low to the horizontal resistance barrier at $216.
While this theoretical target puts Solana price at a new all-time high, investors need to be aware that the Momentum Reversal Indicator (MRI) has flashed a ‘yellow down arrow’ on the daily chart, suggesting that a further continuation of the uptrend will result in a red ‘one’ sell signal that forecasts a one-to-four candlestick correction for SOL.
Therefore, market participants need to be aware of a potential correction.
Regardless of this blip of a pullback, Solana price will see a pitstop at $310, coinciding with the 100% trend-based Fibonacci extension level. Clearing this area will propel it to the intended target at $407.
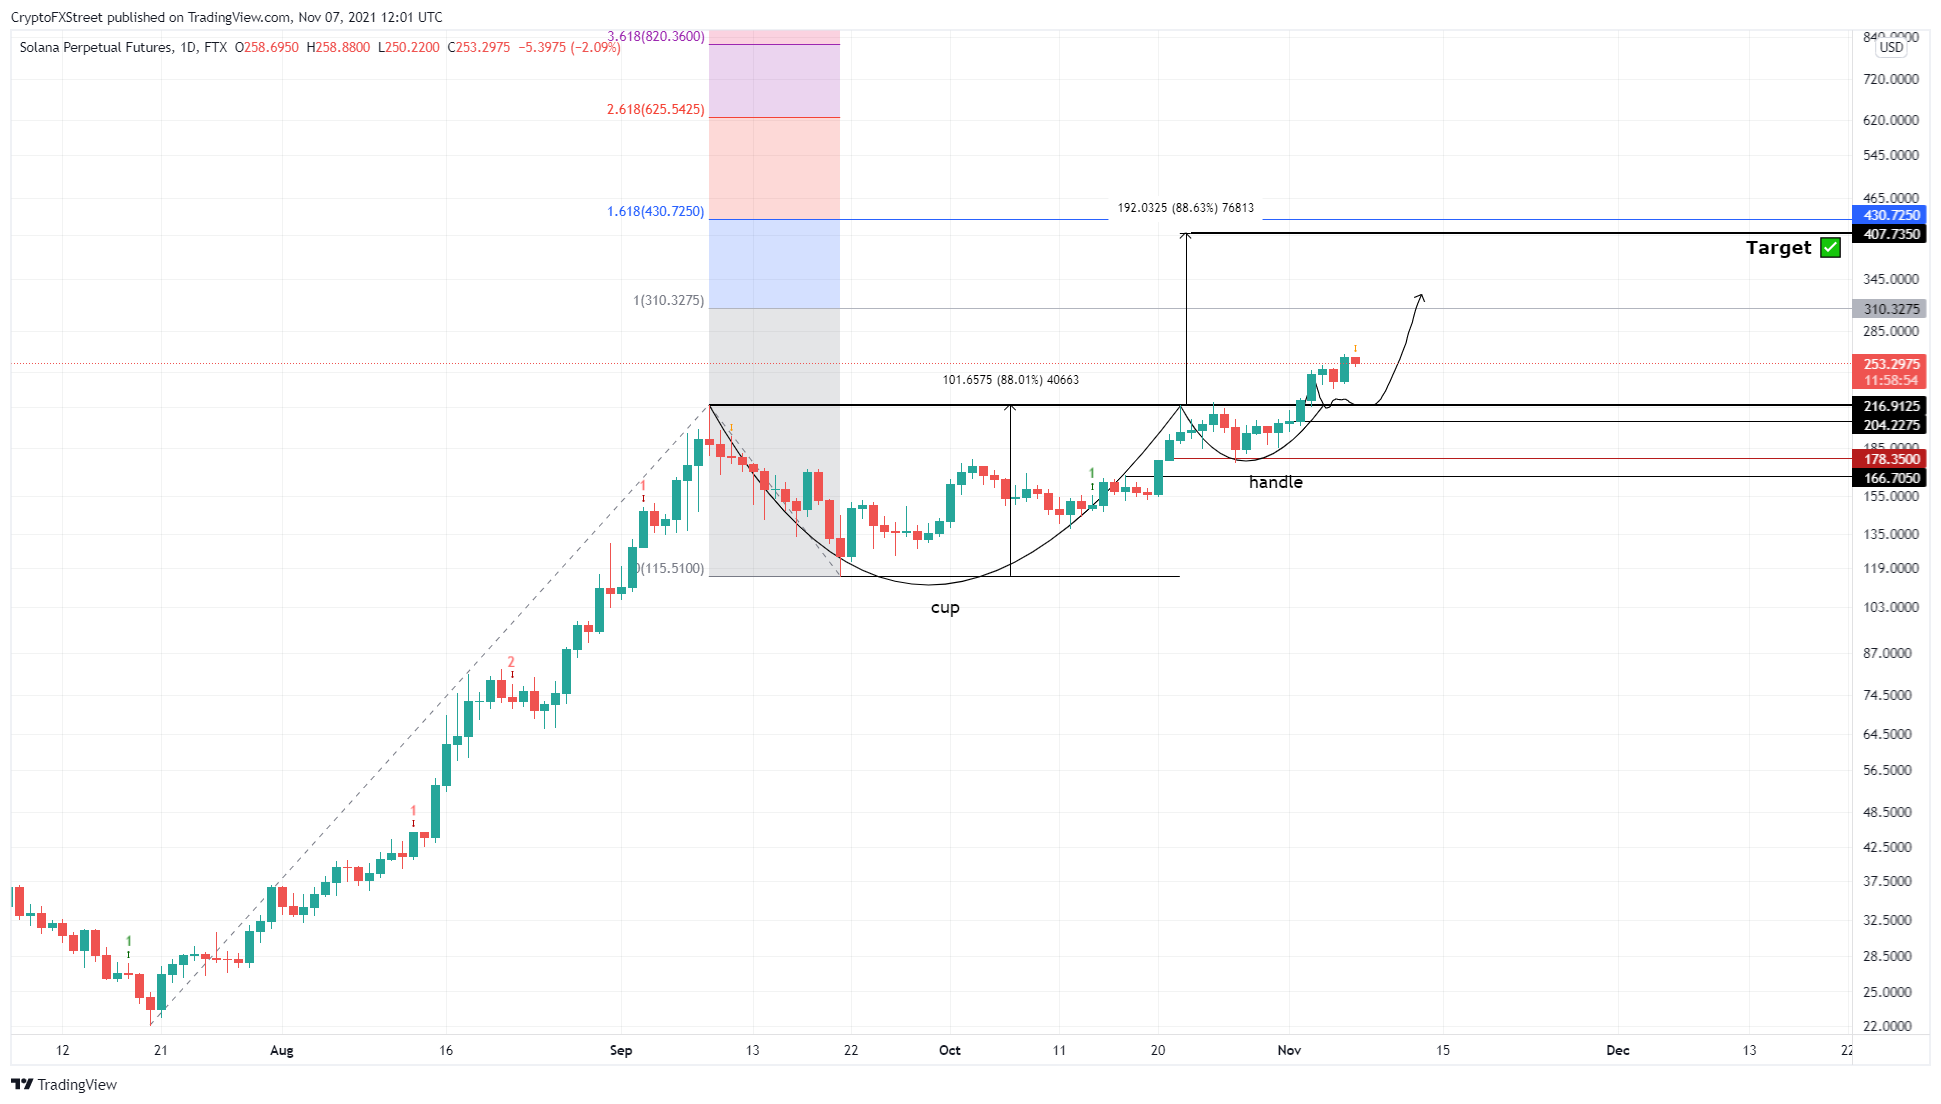
SOL/USDT 1-day chart
On the other hand, if Solana price fails to move higher and the correction knocks it down to $216, the buyers will have another chance at an upswing. If the sellers overwhelm the buying pressure, producing a lower low below $204, it will invalidate the bullish thesis.
In such a case, Solana price could explore lower and revisit $178 or $166 support floor.
Information on these pages contains forward-looking statements that involve risks and uncertainties. Markets and instruments profiled on this page are for informational purposes only and should not in any way come across as a recommendation to buy or sell in these assets. You should do your own thorough research before making any investment decisions. FXStreet does not in any way guarantee that this information is free from mistakes, errors, or material misstatements. It also does not guarantee that this information is of a timely nature. Investing in Open Markets involves a great deal of risk, including the loss of all or a portion of your investment, as well as emotional distress. All risks, losses and costs associated with investing, including total loss of principal, are your responsibility. The views and opinions expressed in this article are those of the authors and do not necessarily reflect the official policy or position of FXStreet nor its advertisers. The author will not be held responsible for information that is found at the end of links posted on this page.
If not otherwise explicitly mentioned in the body of the article, at the time of writing, the author has no position in any stock mentioned in this article and no business relationship with any company mentioned. The author has not received compensation for writing this article, other than from FXStreet.
FXStreet and the author do not provide personalized recommendations. The author makes no representations as to the accuracy, completeness, or suitability of this information. FXStreet and the author will not be liable for any errors, omissions or any losses, injuries or damages arising from this information and its display or use. Errors and omissions excepted.
The author and FXStreet are not registered investment advisors and nothing in this article is intended to be investment advice.
Recommended Content
Editors’ Picks

XRP chart signals 27% jump after SEC-Ripple appeals pause and $50 million settlement
Ripple (XRP) stabilized above $2.00 exemplifying a similar pattern to the largest cryptocurrency by market capitalization, Bitcoin (BTC), which holds firmly above $84,000 at the time of writing on Thursday.

Bitwise lists four crypto ETPs on London Stock Exchange
Bitwise announced on Wednesday that it had listed four of its Germany-issued crypto Exchange-Traded products (ETPs) on the London Stock Exchange. It aims to expand access to its products for Bitcoin (BTC) and Ethereum (ETH) investors and widen its footprint across European markets.

RAY sees double-digit gains as Raydium unveils new Pumpfun competitor
RAY surged 10% on Wednesday as Raydium revealed its new meme coin launchpad, LaunchLab, a potential competitor to Pump.fun — which also recently unveiled its decentralized exchange (DEX) PumpSwap.

Ethereum Price Forecast: ETH face value- accrual risks due to data availability roadmap
Ethereum (ETH) declined 1%, trading just below $1,600 in the early Asian session on Thursday, as Binance Research's latest report suggests that the data availability roadmap has been hampering its value accrual.

Bitcoin Weekly Forecast: Market uncertainty lingers, Trump’s 90-day tariff pause sparks modest recovery
Bitcoin (BTC) price extends recovery to around $82,500 on Friday after dumping to a new year-to-date low of $74,508 to start the week. Market uncertainty remains high, leading to a massive shakeout, with total liquidations hitting $2.18 billion across crypto markets.

The Best brokers to trade EUR/USD
SPONSORED Discover the top brokers for trading EUR/USD in 2025. Our list features brokers with competitive spreads, fast execution, and powerful platforms. Whether you're a beginner or an expert, find the right partner to navigate the dynamic Forex market.