• Repetition of patterns is critical for the further uptrend in Solana.
  • Price action excellently withstood the sharp correction in cryptocurrencies.
  • The next step for Solana is to regain R2 monthly resistance and go for R3 monthly resistance within a few weeks.

Solana (SOL) has had a very choppy ride with price variations of 86% at one point in the market turmoil that made cryptocurrencies roll over at the beginning of the week. Price action in Solana has withstood this hurricane quite well and was at no point really at risk, as a repetitive pattern still shows its importance, even on a correction. 

The pattern is relatively easy to spot and has been going on since August 28. On the chart, it can be recognized by the purple short-term trend lines. Each time a purple line forms the backbone for the next leg upwards. Price comes back down after a significant break higher and includes a new purple short-term trend line again, which is the prelude for another portion higher. This pattern has already repeated itself four times and is still ongoing for the fifth time.

Fibonacci retracement confirms Solana patterns play

On days with a lot of variation in price action, the previous short-term trend lines were used as support in case the previous pattern broke. This was the case on September 7 and September 8.
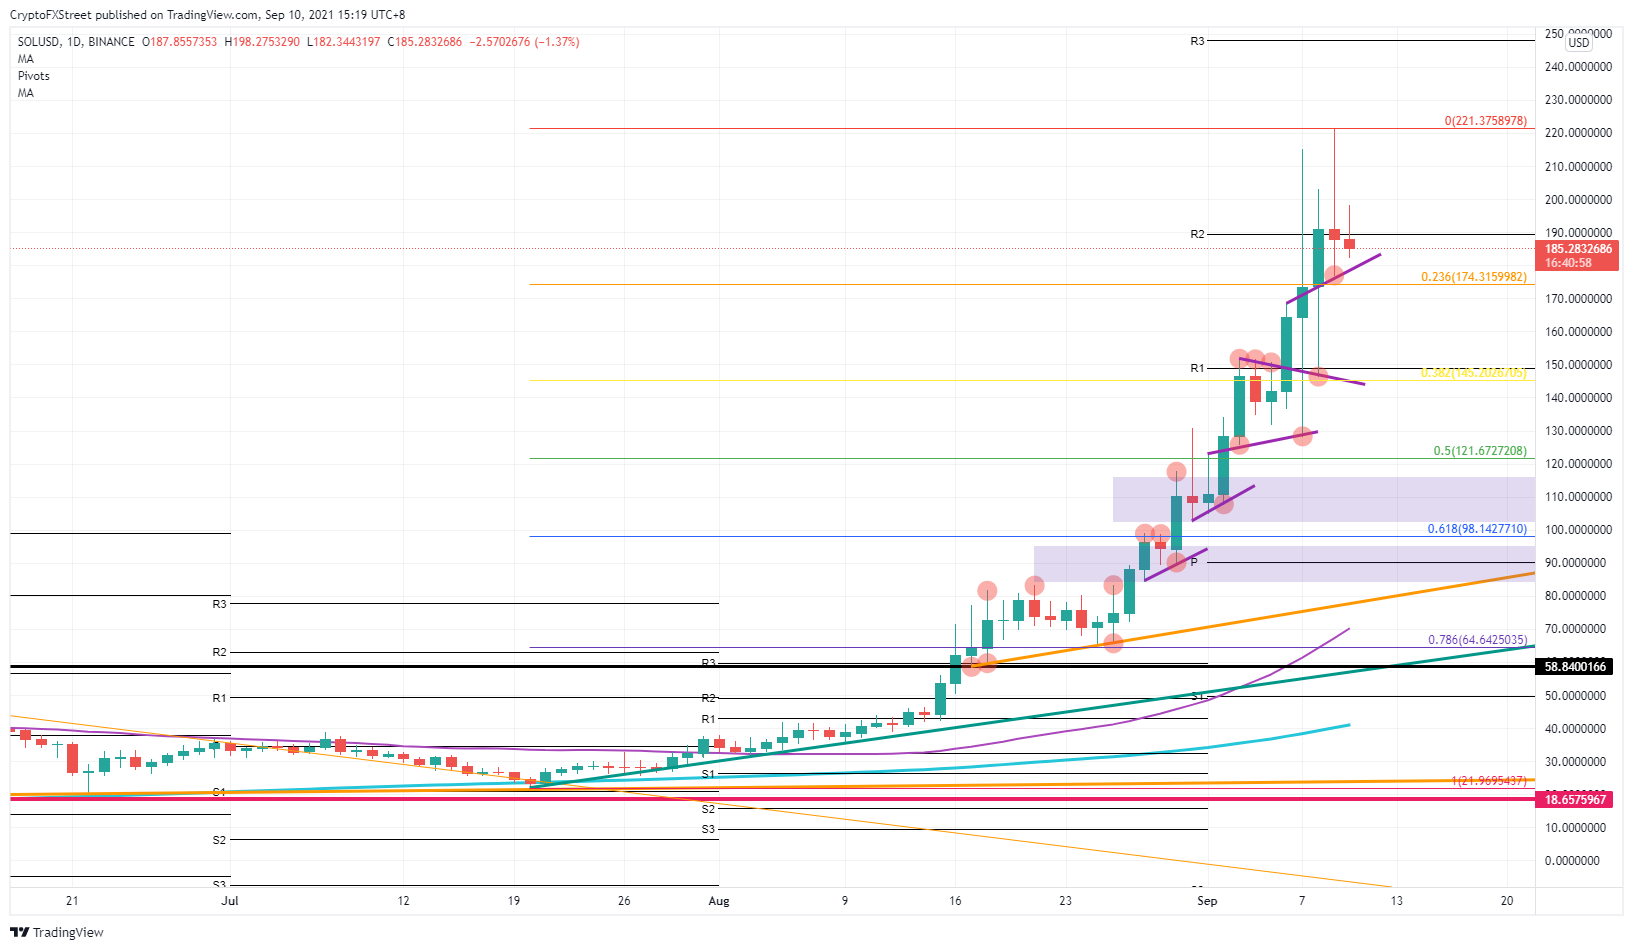
SOL/USD daily chart
SOL/USD daily chart

Although the trend line originating from September 3 is a descending one, it still has its importance as it got two tests on the downside and one from the upside. With resistance turning into support, this level around $150 should withstand a future correction.

For the moment, Solana is testing the price action around $185. With the ascending purple trend line below and the R2 monthly resistance at $190, price action is getting a bit choppy, with buyers cashing in on their profit.

Another reason for the importance of these patterns, and the reason why they will hold support, is that they fall in line quite nicely with a Fibonacci retracement. Not only is there the pattern repetition, but Fibonacci levels are an additional reason for support and buyers to keep adding volume to the rally.

Expect a jump further for a retest of $221.37. From there, it is a clear target toward $250, with just below there the R3 monthly resistance coming in at $248.12.


Information on these pages contains forward-looking statements that involve risks and uncertainties. Markets and instruments profiled on this page are for informational purposes only and should not in any way come across as a recommendation to buy or sell in these assets. You should do your own thorough research before making any investment decisions. FXStreet does not in any way guarantee that this information is free from mistakes, errors, or material misstatements. It also does not guarantee that this information is of a timely nature. Investing in Open Markets involves a great deal of risk, including the loss of all or a portion of your investment, as well as emotional distress. All risks, losses and costs associated with investing, including total loss of principal, are your responsibility. The views and opinions expressed in this article are those of the authors and do not necessarily reflect the official policy or position of FXStreet nor its advertisers. The author will not be held responsible for information that is found at the end of links posted on this page.

If not otherwise explicitly mentioned in the body of the article, at the time of writing, the author has no position in any stock mentioned in this article and no business relationship with any company mentioned. The author has not received compensation for writing this article, other than from FXStreet.

FXStreet and the author do not provide personalized recommendations. The author makes no representations as to the accuracy, completeness, or suitability of this information. FXStreet and the author will not be liable for any errors, omissions or any losses, injuries or damages arising from this information and its display or use. Errors and omissions excepted.

The author and FXStreet are not registered investment advisors and nothing in this article is intended to be investment advice.

Join Telegram

Recommended content


Recommended Content

Editors’ Picks

Ripple on-chain metrics show bullish signs amidst legal struggle with SEC, XRP eyes recovery

Ripple on-chain metrics show bullish signs amidst legal struggle with SEC, XRP eyes recovery

Ripple made a comeback above $0.48 on Tuesday and hovers above that level in Wednesday’s European session. Ripple on-chain metrics such as transaction volume and Network Realized Profit/Loss have turned bullish, supporting a recovery in the altcoin. 

More Ripple News

Bitcoin price falls amidst German government transfers, miners activity

Bitcoin price falls amidst German government transfers, miners activity

Bitcoin (BTC) extends correction on Wednesday and hovers around $61,000 after finding resistance near the $64,000 level on Monday. Recent on-chain data indicates heightened selling activity from Bitcoin miners early in the week. 

More Bitcoin News

Crypto Today: Bitcoin erases gains from end of June, Ethereum declines while Ripple holds

Crypto Today: Bitcoin erases gains from end of June, Ethereum declines while Ripple holds

Bitcoin wipes out gains from the last week of June and falls below $60,000 on Wednesday. Ethereum and top altcoins ranked by market capitalization erased gains as the inflation outlook worsened. Ripple holds on to recent gains and hovers above $0.48 on Wednesday. 

More Cryptocurrencies News

Three reasons why altcoins could shake off losses this week

Three reasons why altcoins could shake off losses this week

On-chain data from Santiment shows that altcoins are currently in the opportunity zone, or generating buy signals. The top three altcoins in the buy zone are Basic Attention Token (BAT), Chromia (CHR), and Highstreet (HIGH), per Santiment. 

More Altcoins News

Bitcoin: BTC price correction could end in July, according to seasonal data

Bitcoin: BTC price correction could end in July, according to seasonal data

Bitcoin (BTC) price appears poised for a decline this week, influenced by slight outflows in US spot ETFs, selling activity among BTC miners, and a combined transfer of 4,690.28 BTC to centralized exchanges by the US and German governments.

Read full analysis

BTC

ETH

XRP