Solana Price Prediction: SOL needs to recover above crucial barrier to retest $200
- Solana price breached through the ascending parallel channel’s lower trend line on October 10.
- A recovery above the $151 support floor will allow the bulls a chance to rally to $200.
- A failure to do so could knock SOL down to $136.50 or $124.83.

Solana price was on a slow uptrend since forming a local bottom on September 21. However, this steady climb was bears’ ploy in disguise as it created an ascending parallel channel. After coiling up for roughly four days, SOL broke below a crucial support floor, indicating a bearish outcome.
Solana price hopes for a recovery
Solana price set up roughly three higher lows and two higher highs since September 21. When these swing points are connected using trend lines, an ascending parallel channel is formed. This technical pattern has a higher chance of a bearish outcome. After nearly a week of consolidation, SOL sliced through the lower trend line of the channel, confirming that a downswing was in play.
However, all is not lost for Solana price as the bulls can make a comeback if the $151 resistance barrier can be flipped into a support level. Doing so will provide the buyers with a firm platform to band together and restart a rally.
Moreover, the Momentum Reversal Indicator (MRI) has flashed a preemptive yellow ‘up’ arrow, suggesting that another red 6-hour candlestick will flash a green ‘one’ buy signal, forecasting a one-to-four candlestick upswing.
Therefore, despite the bearish outlook visible to the naked eye, SOL has a chance to make a comeback and retest the $200 psychological level. Investors need to keep a close eye on the $151 barrier in that case.
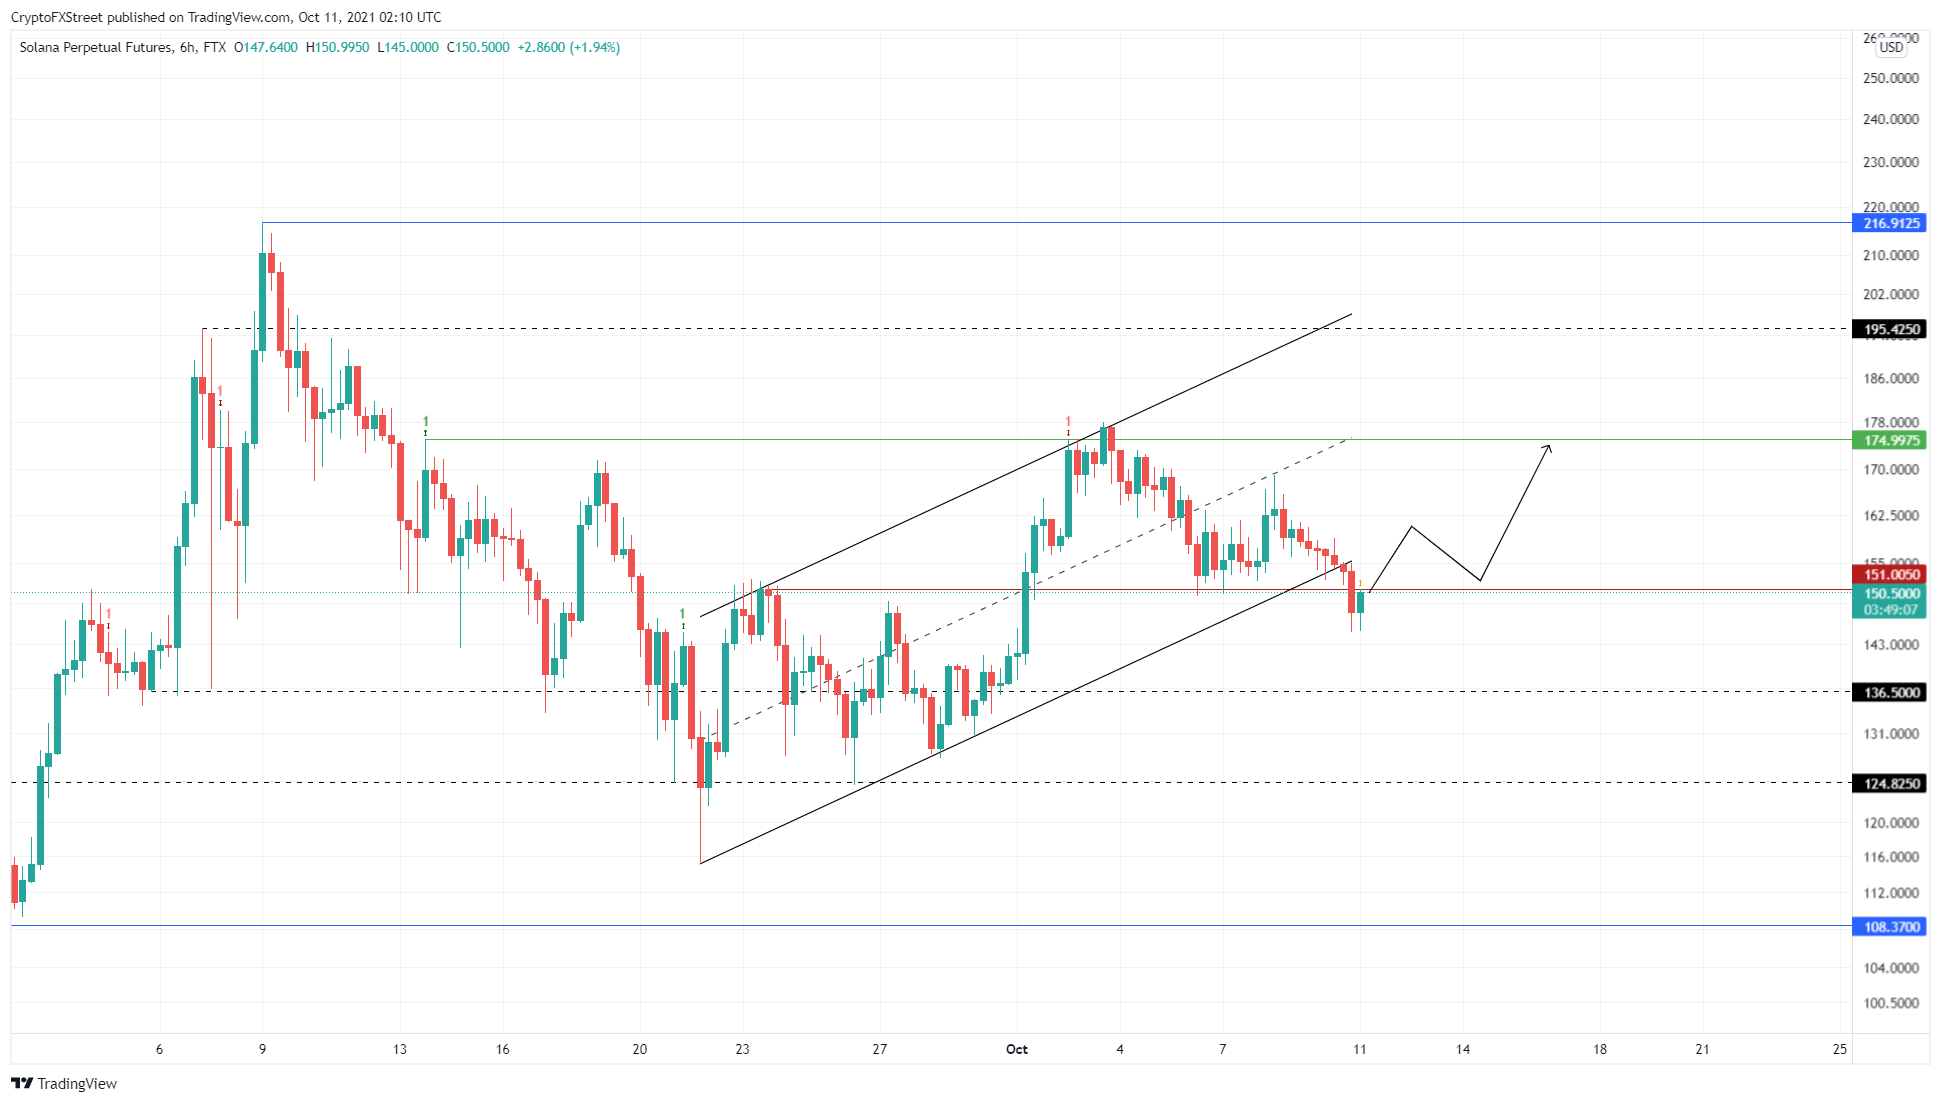
SOL/USDT 6-hour chart
A failure to shatter $151 will lead to a 9.3% correction to $136.50. In some cases, Solana price could also extend this pullback and retest the $124.83 foothold.
On the other hand, a breakdown of $124.83 will invalidate the slight bullish outlook by creating a lower low.
Author

Akash Girimath
FXStreet
Akash Girimath is a Mechanical Engineer interested in the chaos of the financial markets. Trying to make sense of this convoluted yet fascinating space, he switched his engineering job to become a crypto reporter and analyst.


