- Solana price ended its losing streak on Tuesday with Powell as the white knight.
- SOL traders are overthinking their next move as the overall Powell speech was hawkish.
- Biden added oil to the fire by ramping up harsh talk to China.
Solana (SOL) price was able to print a 5% gain after a three-day losing streak that accounted for roughly an 8% loss. Traders used the speech from US Fed Chair Jerome Powell to break the trend and print another good trading day, as the word "disinflationary" was their cue to start buying into Solana's price action. Traders are letting the dust settle and finding out that Jerome Powell's speech was actually not that dovish at all.
Solana is set to adjust with 20% drop to come
Solana price has been able to jump back above $24, thanks to one word from the mouth of Fed Chairman Jerome Powell: "Disinflationary." It appeared that the whole speech did not matter, and traders were cherry picking the words they wanted to hear. The mood is far from euphoric this morning as the hangover kicks in with the summary that the tone from Powell was hawkish. Geopolitical tail risks are elevated again after Biden's State of the Union, in which he put the Chinese relationship on edge with talk of the alleged spy balloon.
SOL is thus facing quite real headwinds and could soon see bullish traders drop off as fatigue builds. They had a good run in January, but February looks more challenging, which means that bulls will start looking for the next best thing to invest their money in. Expect Solana price to take a step back toward $18.66, which means a 20% correction with more US Dollar strength to come in along the way.
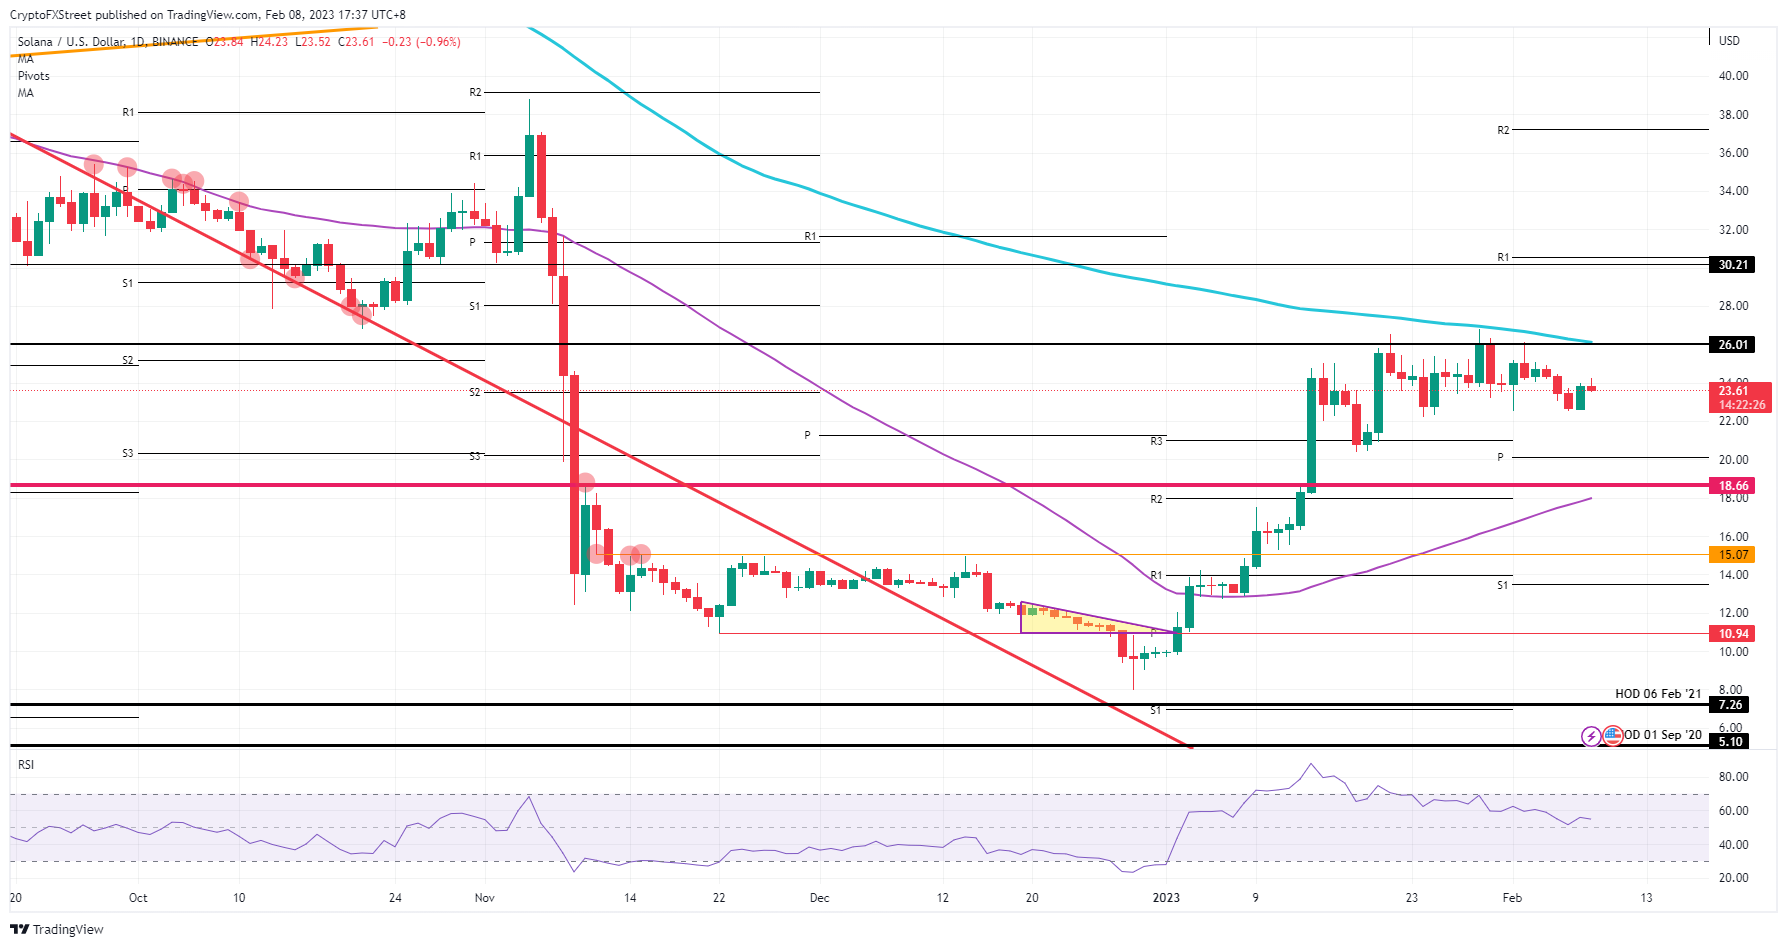
SOL/USD daily chart
If Solana price can get away from the current subdued mood, expect a fairly quick jump toward $26. That level is key to see if another $4 worth of gains can be projected in the near future. The $30 price tag is a pivotal historical level, and the 200-day Simple Moving Average (SMA) is nearby. The price target at $30 would fall in line with the monthly R1 resistance level and the Relative Strength Index nearing the overbought border again.
Information on these pages contains forward-looking statements that involve risks and uncertainties. Markets and instruments profiled on this page are for informational purposes only and should not in any way come across as a recommendation to buy or sell in these assets. You should do your own thorough research before making any investment decisions. FXStreet does not in any way guarantee that this information is free from mistakes, errors, or material misstatements. It also does not guarantee that this information is of a timely nature. Investing in Open Markets involves a great deal of risk, including the loss of all or a portion of your investment, as well as emotional distress. All risks, losses and costs associated with investing, including total loss of principal, are your responsibility. The views and opinions expressed in this article are those of the authors and do not necessarily reflect the official policy or position of FXStreet nor its advertisers. The author will not be held responsible for information that is found at the end of links posted on this page.
If not otherwise explicitly mentioned in the body of the article, at the time of writing, the author has no position in any stock mentioned in this article and no business relationship with any company mentioned. The author has not received compensation for writing this article, other than from FXStreet.
FXStreet and the author do not provide personalized recommendations. The author makes no representations as to the accuracy, completeness, or suitability of this information. FXStreet and the author will not be liable for any errors, omissions or any losses, injuries or damages arising from this information and its display or use. Errors and omissions excepted.
The author and FXStreet are not registered investment advisors and nothing in this article is intended to be investment advice.
Recommended Content
Editors’ Picks

IRS says crypto staking should be taxed in response to lawsuit
The IRS stated that rewards from cryptocurrency staking are taxable upon receipt, according to a Bloomberg report on Monday, which stated the agency rejected a legal argument that sought to delay taxation until such rewards are sold or exchanged.
Solana dominates Bitcoin, Ethereum in price performance and trading volume: Glassnode
Solana is up 6% on Monday following a Glassnode report indicating that SOL has seen more capital increase than Bitcoin and Ethereum. Despite the large gains suggesting a relatively heated market, SOL could still stretch its growth before establishing a top for the cycle.
Ethereum Price Forecast: ETH risks a decline to $3,000 as investors realize increased profits and losses
Ethereum is up 4% on Monday despite increased selling pressure across long-term and short-term holders in the past two days. If whales fail to maintain their recent buy-the-dip attitude, ETH risks a decline below $3,000.

Crypto Today: BTC hits new Trump-era low as Chainlink, HBAR and AAVE lead market recovery
The global cryptocurrency market cap shrank by $500 billion after the Federal Reserve's hawkish statements on December 17. Amid the market crash, Bitcoin price declined 7.2% last week, recording its first weekly timeframe loss since Donald Trump’s re-election.

Bitcoin: 2025 outlook brightens on expectations of US pro-crypto policy
Bitcoin price has surged more than 140% in 2024, reaching the $100K milestone in early December. The rally was driven by the launch of Bitcoin Spot ETFs in January and the reduced supply following the fourth halving event in April.

Best Forex Brokers with Low Spreads
VERIFIED Low spreads are crucial for reducing trading costs. Explore top Forex brokers offering competitive spreads and high leverage. Compare options for EUR/USD, GBP/USD, USD/JPY, and Gold.