• Solana is extremely overbought on the daily and weekly charts.
  • Bearish Shooting Star candlestick pattern at the extreme new highs indicates a top is likely in.
  • SOL has experienced no meaningful pullback in 8-weeks. 

Solana price has hit another new all-time high of $216 during today’s trading session. As the New York trading session winds down, a very bearish Shooting Star candlestick pattern develops daily. 

Solana price to test Fibonacci and Ichimoku confluence zone as support

Solana has made some impressive gains over the past eight weeks, easily outperforming its peers and propelling itself into the top ten in market capitalization. Still, further upside potential is limited given the extremes found across multiple timeframes. There are several highly overbought levels in Solana’s oscillators.

First, the weekly Relative Strength Index is at 91.80 - above the second overbought condition in a bull market. The Relative Strength Index on the daily chart has been trading between 80 and 90 since August 28th. A rising wedge pattern has now formed on the Relative Strength Index, pointing to an imminent sell-off. 

Second, the Composite Index shows its sloping down, suggesting a cross below its slow and fast-moving averages will happen very soon. There is a clear and extended regular bearish divergence between the Solana price chart and the Composite Index.

Third, the Optex Bands are extremely overbought and have been trading in an overbought condition since September. Thus, a move below these levels will likely be the final oscillator trigger for a violent corrective action south. 

The first support zone Solana will probably reach is the $115 value area. This is because the weekly Tenkan-Sen, Kijun-Sen and 38.2% Fibonacci retracement all exist within the $115 price range. 

Solana US dollar price chart

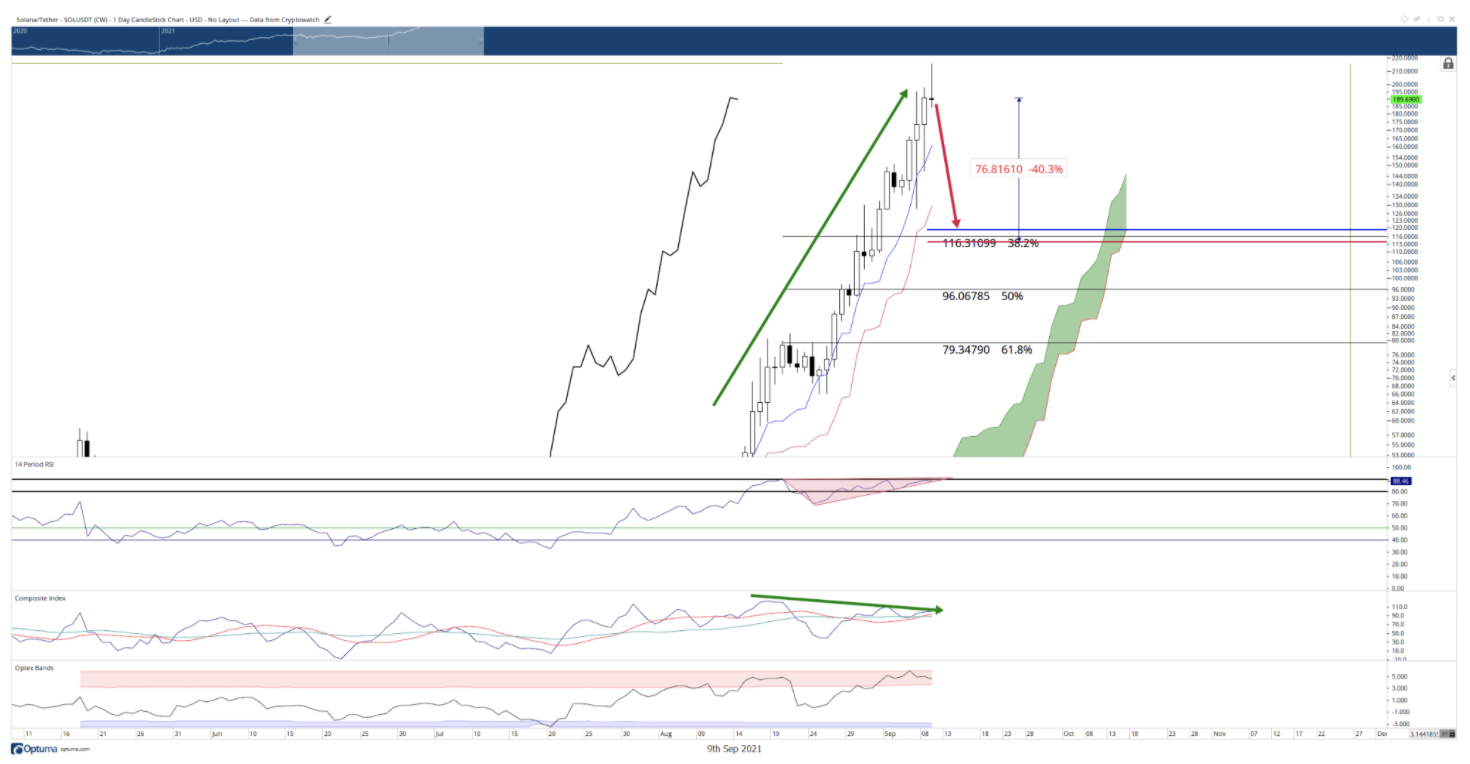
SOL/USDT Daily Chart

Solana price action is, however, in price discovery mode and has become parabolic. 

When an instrument is in such conditions, any attempt to identify the ‘top’ can be foolhardy. Bulls and bears should all be aware that prices can still move higher, despite the daily and weekly timeframes pointing to a severely overbought market. 

Therefore, bears will want to avoid any short opportunities if bulls push Solana to $225.


Information on these pages contains forward-looking statements that involve risks and uncertainties. Markets and instruments profiled on this page are for informational purposes only and should not in any way come across as a recommendation to buy or sell in these assets. You should do your own thorough research before making any investment decisions. FXStreet does not in any way guarantee that this information is free from mistakes, errors, or material misstatements. It also does not guarantee that this information is of a timely nature. Investing in Open Markets involves a great deal of risk, including the loss of all or a portion of your investment, as well as emotional distress. All risks, losses and costs associated with investing, including total loss of principal, are your responsibility. The views and opinions expressed in this article are those of the authors and do not necessarily reflect the official policy or position of FXStreet nor its advertisers. The author will not be held responsible for information that is found at the end of links posted on this page.

If not otherwise explicitly mentioned in the body of the article, at the time of writing, the author has no position in any stock mentioned in this article and no business relationship with any company mentioned. The author has not received compensation for writing this article, other than from FXStreet.

FXStreet and the author do not provide personalized recommendations. The author makes no representations as to the accuracy, completeness, or suitability of this information. FXStreet and the author will not be liable for any errors, omissions or any losses, injuries or damages arising from this information and its display or use. Errors and omissions excepted.

The author and FXStreet are not registered investment advisors and nothing in this article is intended to be investment advice.

Join Telegram

Recommended content


Recommended Content

Editors’ Picks

Celebrity meme coins controversy continues amid Pump.fun revenue dominance

Celebrity meme coins controversy continues amid Pump.fun revenue dominance

Pump.fun outperformed the Ethereum blockchain on Tuesday after raking in $1.99 million. Following this achievement, a meme coin based on actress Sydney Sweeney was the subject of controversy after its developers dumped their bags on investors.

More Meme Coins News

PEPE's on-chain metrics indicate potential rally after weeks of silence

PEPE's on-chain metrics indicate potential rally after weeks of silence

PEPE has struggled to see any significant price move after reaching an all-time high in May. Increased adoption rate and low MVRV ratio indicate a bullish run may be on the horizon. A single PEPE outflow from Binance worth $14.7 million gives credence to signs of bullish expectation.

More Pepe News

Ethereum has failed to overcome key resistance despite bullish sentiment surrounding ETH ETF

Ethereum has failed to overcome key resistance despite bullish sentiment surrounding ETH ETF

Ethereum (ETH) is down more than 1.4% on Tuesday following another ETH sale from the Ethereum Foundation. Meanwhile, crypto exchange Gemini's recent report reveals that ETH ETF could see about $5 billion in net inflows within six months of launch.

More Ethereum News

Crypto community blasts Polkadot following report of treasury spending

Crypto community blasts Polkadot following report of treasury spending

Polkadot reports $87 million of treasury spending during H1. Crypto community members expressed harsh feelings toward the DOT team's high spending. DOT is up more than 2% in the past 24 hours but risks correction following the report.

More Polkadot News

Bitcoin: BTC price correction could end in July, according to seasonal data

Bitcoin: BTC price correction could end in July, according to seasonal data

Bitcoin (BTC) price appears poised for a decline this week, influenced by slight outflows in US spot ETFs, selling activity among BTC miners, and a combined transfer of 4,690.28 BTC to centralized exchanges by the US and German governments.

Read full analysis

BTC

ETH

XRP