-
Solana Price Is currently forming a triangle consolidation.
-
The relative strength index is creating bullish divergence.
-
Traders should wait for a breakout to begin.
Solana Price is still coiling inside a triangle consolidation. The 2-day chart is adding more confluence that a breakout will soon commence.
Solana price says buy the breakout.
Solana price should have traders on high alert, as the centralized smart contract token is ready to make its next move. The 2-day chart shows four corrective wave patterns (ABCD) that fit the criteria of a prospective coiling triangle. It is worth noting that ‘E’ waves are commonly known to go sideways and form triangles in their own right, so traders should stay away from jumping in too soon.
Solana price is also getting added confluence by The Relative Strength Index, displaying a bullish divergence from the lows printed throughout the last few weeks. However, it should be noted that triangles are commonly known to trap early traders in the wrong direction. Thus, traders should consider Solana as fluctuating within a no trade-zone until confirmation of the next trend arrives.
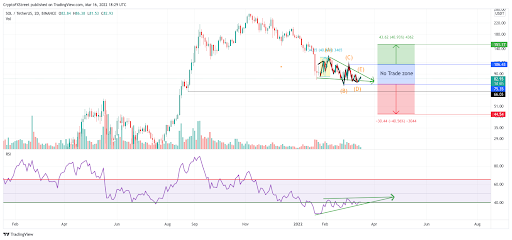
At the current time, a break below the ‘D’ wave at $75.35 could invalidate the no-trade zone idea and will likely be the catalyst to plummet Solana 40% lower into the $45.00 zone. On the contrary, if bulls can carry Solana's price to the higher end of the range, a touch at the current wave ‘C’ of $106.43 could propel Solana's price upwards of 40% into $150.00.
Information on these pages contains forward-looking statements that involve risks and uncertainties. Markets and instruments profiled on this page are for informational purposes only and should not in any way come across as a recommendation to buy or sell in these assets. You should do your own thorough research before making any investment decisions. FXStreet does not in any way guarantee that this information is free from mistakes, errors, or material misstatements. It also does not guarantee that this information is of a timely nature. Investing in Open Markets involves a great deal of risk, including the loss of all or a portion of your investment, as well as emotional distress. All risks, losses and costs associated with investing, including total loss of principal, are your responsibility. The views and opinions expressed in this article are those of the authors and do not necessarily reflect the official policy or position of FXStreet nor its advertisers. The author will not be held responsible for information that is found at the end of links posted on this page.
If not otherwise explicitly mentioned in the body of the article, at the time of writing, the author has no position in any stock mentioned in this article and no business relationship with any company mentioned. The author has not received compensation for writing this article, other than from FXStreet.
FXStreet and the author do not provide personalized recommendations. The author makes no representations as to the accuracy, completeness, or suitability of this information. FXStreet and the author will not be liable for any errors, omissions or any losses, injuries or damages arising from this information and its display or use. Errors and omissions excepted.
The author and FXStreet are not registered investment advisors and nothing in this article is intended to be investment advice.
Recommended Content
Editors’ Picks

Top 3 Price Prediction Bitcoin, Ethereum, Ripple: Bulls target $100,000 BTC, $2,000 ETH, and $3 XRP
Bitcoin (BTC) is stabilizing around $95,000 at the time of writing on Wednesday, and a breakout suggests gains toward $100,000. Ethereum (ETH) and Ripple (XRP) followed BTC’s footsteps and hovered around their key levels.

Tether mints 3 billion USDT on Ethereum and TRON as markets stabilize
Tether ramps up its minting activity amid surging demand for stablecoins, often signaling heightened trading and liquidity needs. The issuer of the leading stablecoin by market capitalization has minted 2 billion USDT on Ethereum and an additional 1 billion USDT on the TRON network.

SEC delays decision on Franklin Templeton’s spot XRP ETF to June 2025
The Securities and Exchange Commission (SEC) has postponed its decision on Franklin Templeton’s spot XRP ETF, extending the review period to June 17, 2025. XRP traded at approximately $2.24 at press time, rising 7% over the past week, according to CoinGecko.

Trump Media announces new token launch and native crypto wallet in latest Shareholder letter
Trump Media unveils plans to launch a utility token and crypto wallet to monetize Truth Social and expand its streaming services. Markets react with a 10% drawdown on the Solana-hosted official TRUMP memecoin.

Bitcoin Weekly Forecast: BTC consolidates after posting over 10% weekly surge
Bitcoin price is consolidating around $94,000 at the time of writing on Friday, holding onto the recent 10% increase seen earlier this week. This week’s rally was supported by strong institutional demand, as US spot ETFs recorded a total inflow of $2.68 billion until Thursday.

The Best brokers to trade EUR/USD
SPONSORED Discover the top brokers for trading EUR/USD in 2025. Our list features brokers with competitive spreads, fast execution, and powerful platforms. Whether you're a beginner or an expert, find the right partner to navigate the dynamic Forex market.