- Solana price has been in a solid rally higher until last week.
- Sellers are dictating price action with a trend line as an essential reference point.
- An early trend line that favored the bulls at the beginning of September is the last support bulls have before sellers go another leg lower in SOL.
Solana (SOL) was on a tear at the beginning of September. Since the failed attempt on September 9 to keep price action elevated, SOL has been fading and trading lower towards lower support levels that have been broken quite easily each time. Although bulls broke the red descending trend line, a rejection at the 23.6% Fibonacci level spells trouble.
Solana price might open the door to more downside
Solana price had a perfect run at the beginning of September, but price action retreated on September 9 after hitting $221. Sellers overhauled price action as buyers took too much profit and the momentum in favor of the bulls faded. Sellers since then broke a few Fibonacci levels and the monthly R1 resistance levels to the downside.
For now, the purple descending trend line, originating from September 3, is holding the act of the bulls together. But the force from the red descending trend line is starting to squeeze price action in SOL against the purple line, ready for a break lower. With already three confirmed tests to the downside, this purple trend line is undoubtedly a force to be reckoned with.
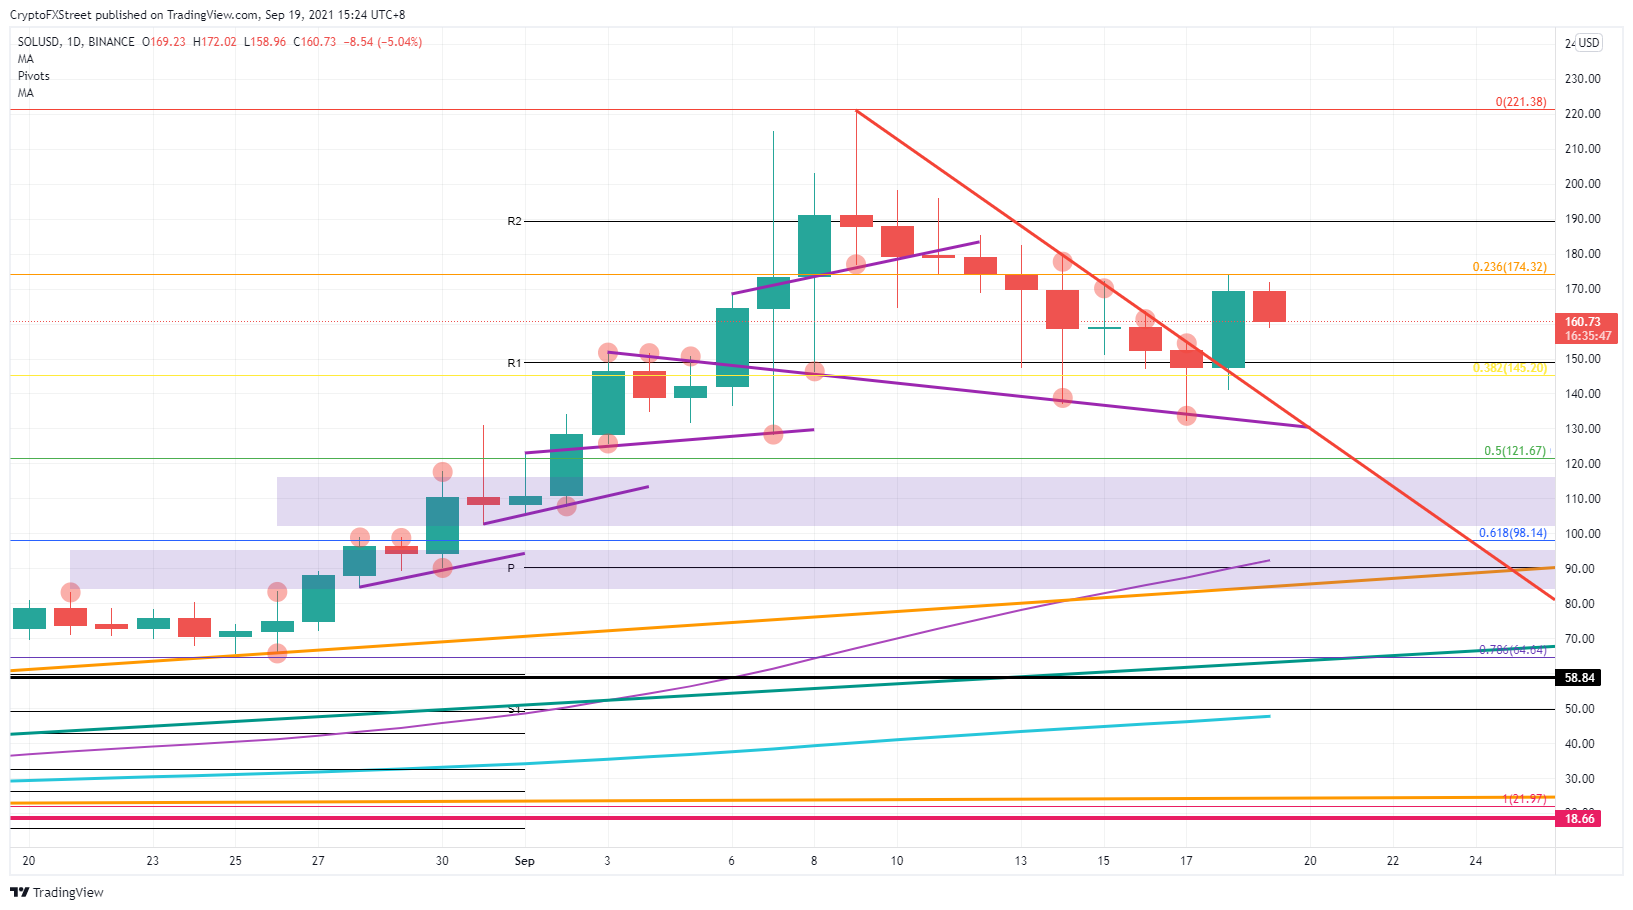
SOL/USD daily chart
With the squeeze in full effect, expect a lower break as the red trend line will be tested again soon and will be broken back to the downside. Proof can be found in the fact that the descending trend line has been protected already four times by sellers and will have scared each time more buyers out of their positions. The sellers’ next level of interest in profit-taking will be around the 61.8% Fibonacci level at $100. Add the monthly pivot near $90 as an additional factor, and this zone will offer a good entry for a fade-in trade for buyers.
When market sentiment would roll over sooner in favor of some favorable tailwinds for Solana’s price action, watch the break of the 23.6% Fibonacci level at $174. Buyers will emerge on that break, and bulls will kick price action into gear for a rerun towards £221 within a matter of weeks.
Information on these pages contains forward-looking statements that involve risks and uncertainties. Markets and instruments profiled on this page are for informational purposes only and should not in any way come across as a recommendation to buy or sell in these assets. You should do your own thorough research before making any investment decisions. FXStreet does not in any way guarantee that this information is free from mistakes, errors, or material misstatements. It also does not guarantee that this information is of a timely nature. Investing in Open Markets involves a great deal of risk, including the loss of all or a portion of your investment, as well as emotional distress. All risks, losses and costs associated with investing, including total loss of principal, are your responsibility. The views and opinions expressed in this article are those of the authors and do not necessarily reflect the official policy or position of FXStreet nor its advertisers. The author will not be held responsible for information that is found at the end of links posted on this page.
If not otherwise explicitly mentioned in the body of the article, at the time of writing, the author has no position in any stock mentioned in this article and no business relationship with any company mentioned. The author has not received compensation for writing this article, other than from FXStreet.
FXStreet and the author do not provide personalized recommendations. The author makes no representations as to the accuracy, completeness, or suitability of this information. FXStreet and the author will not be liable for any errors, omissions or any losses, injuries or damages arising from this information and its display or use. Errors and omissions excepted.
The author and FXStreet are not registered investment advisors and nothing in this article is intended to be investment advice.
Recommended Content
Editors’ Picks

Litecoin Price Prediction: LTC tries to retake $100 resistance as miners halt sell-off
Litecoin price grazed 105 mark on Monday, rebounding 22% from the one-month low of $87 recorded during last week’s market crash. On-chain data shows sell pressure among LTC miners has subsided. Is the bottom in?

Bitcoin fails to recover as Metaplanet buys the dip
Bitcoin price struggles around $95,000 after erasing gains from Friday’s relief rally over the weekend. Bitcoin’s weekly price chart posts the first major decline since President-elect Donald Trump’s win in November.

SEC Commissioner Hester Pierce sheds light on Ethereum ETF staking under new administration
In a Friday interview with Coinage, SEC Commissioner Hester Peirce discussed her optimism about upcoming regulatory changes as the agency transitions to new leadership under President Trump’s pick for new Chair, Paul Atkins.

Bitcoin dives 3% from its recent all-time high, is this the cycle top?
Bitcoin investors panicked after the Fed's hawkish rate cut decision, hitting the market with high selling pressure. Bitcoin's four-year market cycle pattern indicates that the recent correction could be temporary.
Bitcoin: 2025 outlook brightens on expectations of US pro-crypto policy
Bitcoin price has surged more than 140% in 2024, reaching the $100K milestone in early December. The rally was driven by the launch of Bitcoin Spot ETFs in January and the reduced supply following the fourth halving event in April.

Best Forex Brokers with Low Spreads
VERIFIED Low spreads are crucial for reducing trading costs. Explore top Forex brokers offering competitive spreads and high leverage. Compare options for EUR/USD, GBP/USD, USD/JPY, and Gold.