![]() Jonathan Morgan
Jonathan Morgan
Independent Analyst
- Solana price moves against the most critical resistance level on its chart.
- If bulls can close SOL above this resistance zone, a 25% rally could occur.
- Sellers could push Solana lower by nearly 30% if resistance holds.
Solana price action has seen persistent bullish pressure over the past three trading days. As a result, buyers continue to push SOL higher inch by inch, precisely on top of the single greatest resistance cluster on its daily Ichimoku chart.
Solana price at the precipice of a significant rally or a major sell-off
Solana price action is currently testing its final primary resistance zone at the $120 value area. There are three technical resistance levels that SOL bulls must move and close above to initiate a new uptrend:
- The 100% Fibonacci expansion at $116.
- The bottom trendline of the bull flag (blue linear regression channel) at $116.
- The daily Kijun-Sen at $120.
If bulls can push Solana price to a close above all three of those levels, then the path to the next major resistance level at $144 becomes much more manageable as resistance dies off considerably. However, failure to achieve a close at or above $120 could signal disaster.
There are two red arrows on the chart image below, one on the candlestick chart and another on the Composite Index. The red arrow on the candlestick chart is pointing down, displaying a series of lower highs. The red arrow on the Composite Index is pointing up, indicating higher highs. The discrepancy between the candlestick chart and the Composite Index is known as hidden bearish divergence.
Hidden bearish divergence is only valid if an instrument is already in a downtrend (which Solana is). It is a warning sign that the current upswing is likely weakening and that the dominant and overall downtrend will continue. When hidden bearish divergence appears, and price action is against a resistance level or zone, then the likelihood of a continued downtrend substantially increases.
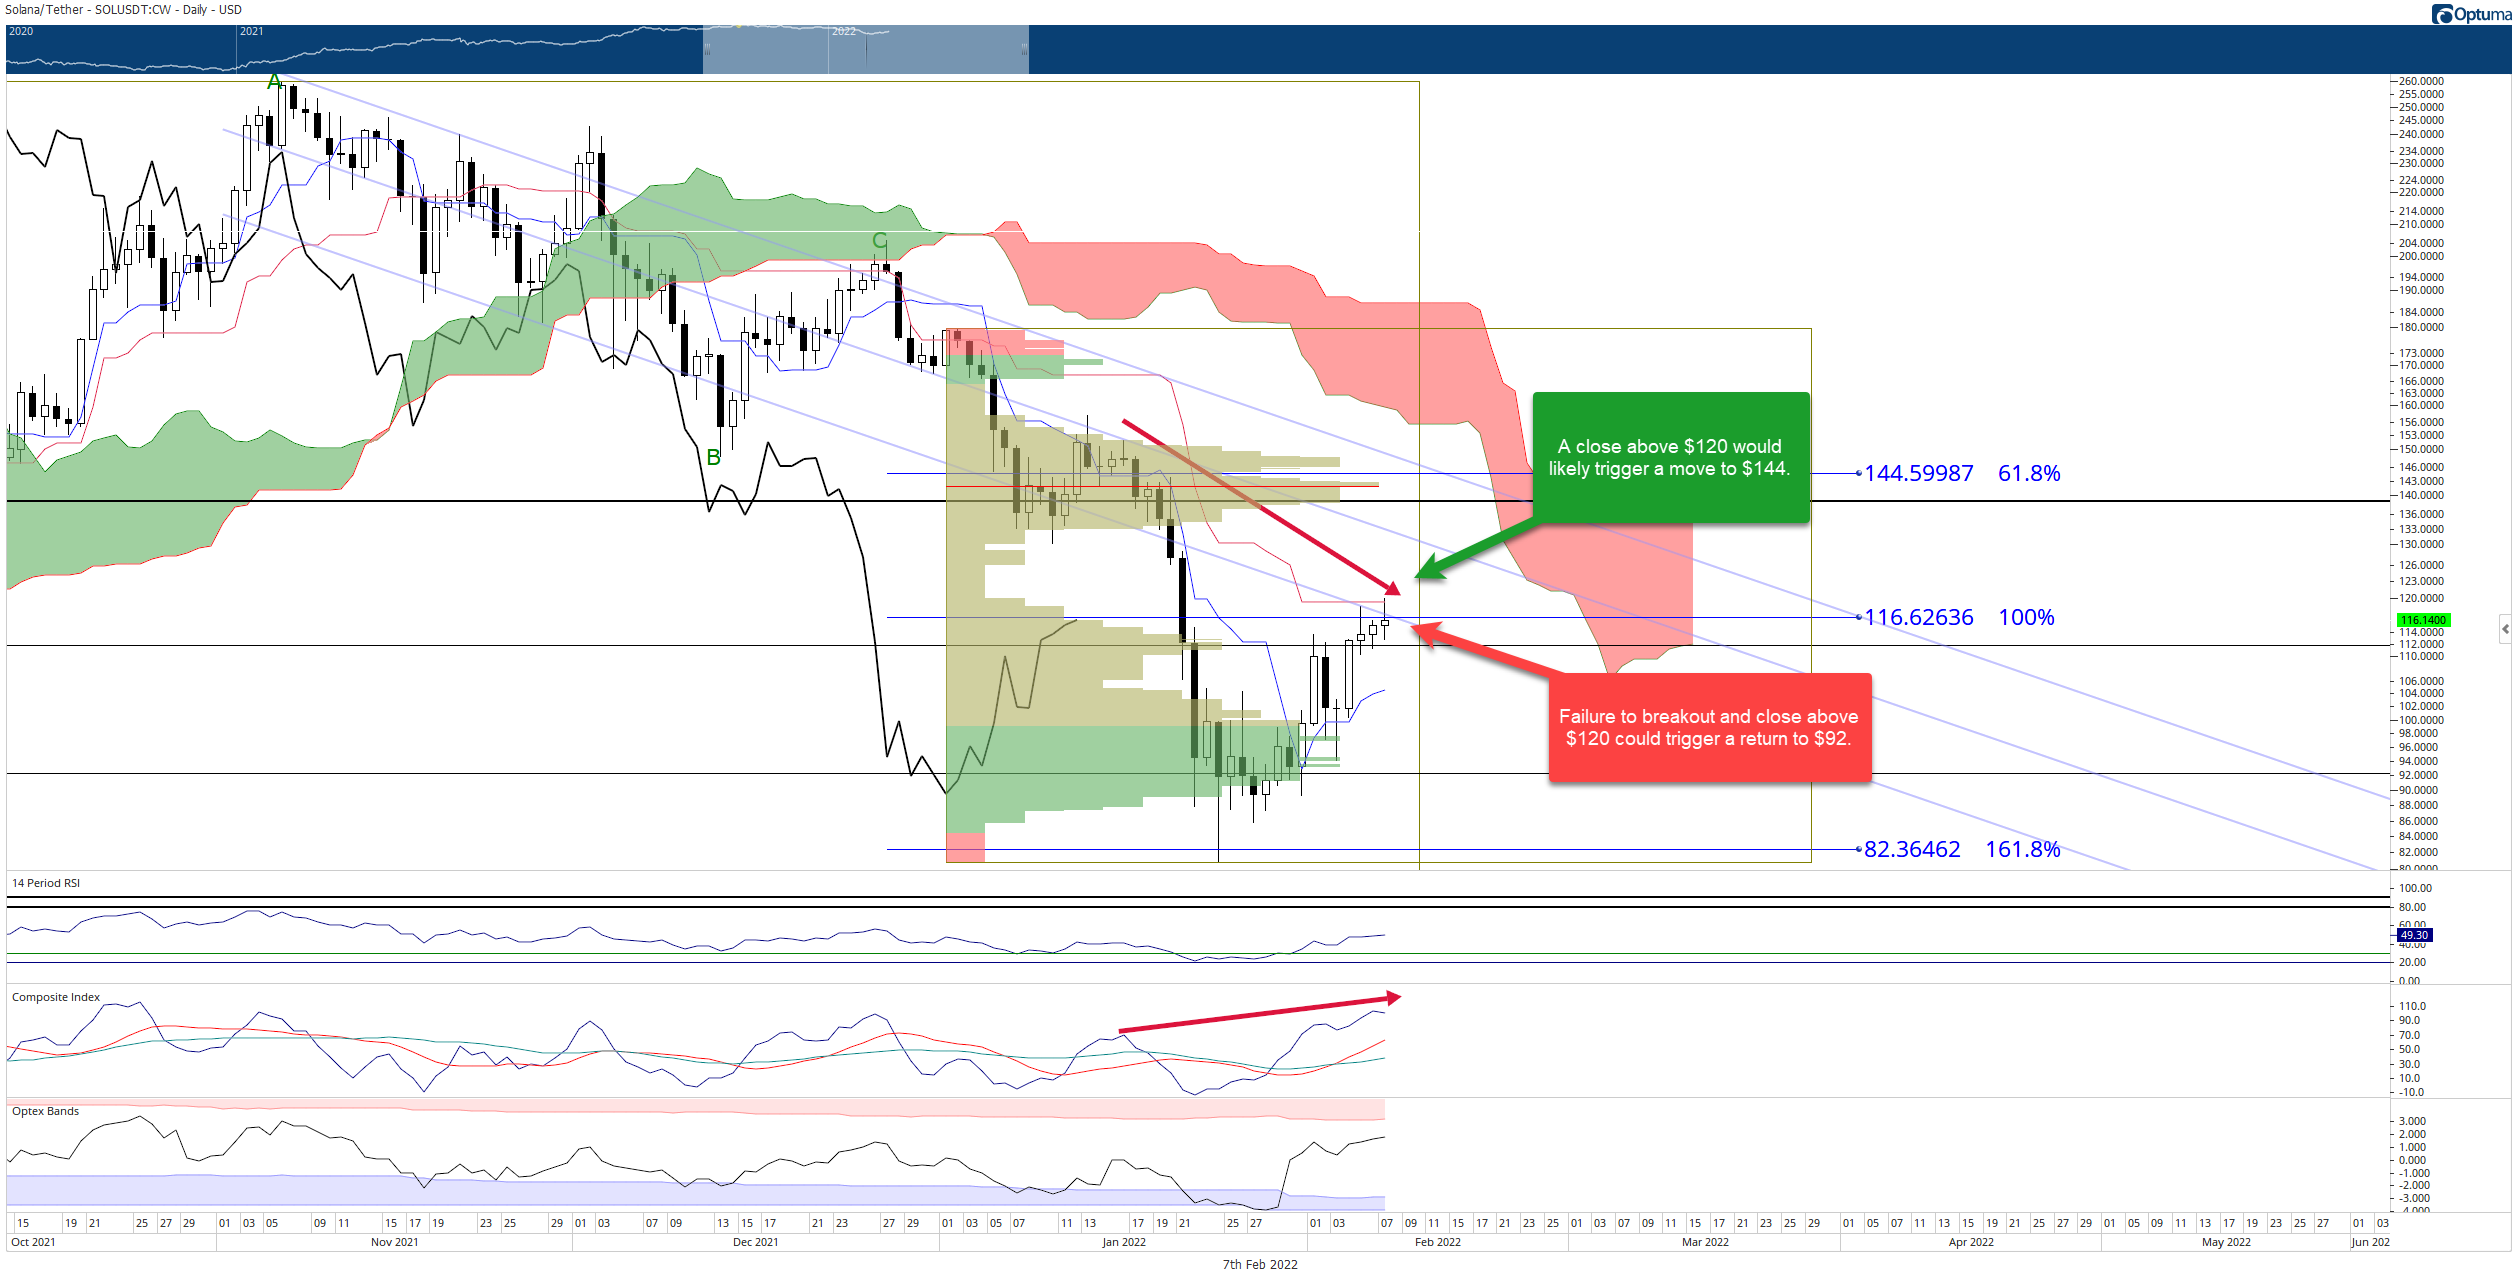
SOL/USDT Daily Ichimoku Kinko Hyo Chart
Failure to breakout above the $120 value area for Solana price would result in, at minimum, a retest of the 61.8% Fibonacci retracement at $92 and possibly even lower to the 161.8% Fibonacci retracement and 2022 low near $82.
Note: All information on this page is subject to change. The use of this website constitutes acceptance of our user agreement. Please read our privacy policy and legal disclaimer. Opinions expressed at FXstreet.com are those of the individual authors and do not necessarily represent the opinion of FXstreet.com or its management. Risk Disclosure: Trading foreign exchange on margin carries a high level of risk, and may not be suitable for all investors. The high degree of leverage can work against you as well as for you. Before deciding to invest in foreign exchange you should carefully consider your investment objectives, level of experience, and risk appetite. The possibility exists that you could sustain a loss of some or all of your initial investment and therefore you should not invest money that you cannot afford to lose. You should be aware of all the risks associated with foreign exchange trading, and seek advice from an independent financial advisor if you have any doubts.
Recommended Content
Editors’ Picks

PEPE Price Forecast: PEPE could rally to double digits if it breaks above its key resistance level
Pepe (PEPE) memecoin approaches its descending trendline, trading around $0.000007 on Tuesday; a breakout indicates a bullish move ahead.

Tron Price Prediction: Tether’s $1B move triggers TRX ahead of US Congress stablecoin bill review on Wednesday
Tron price defied the broader crypto market downtrend, surging 3% to $0.25 on Monday. This bullish momentum comes as stablecoin issuer Tether minted another $1 billion worth of USDT on the Tron network, according to on-chain data from Arkham.

Ethereum Price Forecast: Short-term holders spark $400 million in realized losses, staking flows surge
Ethereum (ETH) bounced off the $1,800 support on Monday following increased selling pressure from short-term holders (STHs) and tensions surrounding President Donald Trump's reciprocal tariff kick-off on April 2.

BlackRock CEO warns Bitcoin could replace US Dollar as global reserve currency, crypto ETFs witness inflows
BlackRock CEO Larry Fink stated in an annual letter to investors on Monday that the US national debt could cause the Dollar's global reserve status to be replaced with Bitcoin if investors begin to see the digital currency as a safer asset.

Bitcoin: BTC remains calm before a storm
Bitcoin's price has been consolidating between $85,000 and $88,000 this week. A K33 report explains how the markets are relatively calm and shaping up for volatility as traders absorb the tariff announcements. PlanB’s S2F model shows that Bitcoin looks extremely undervalued compared to Gold and the housing market.

The Best brokers to trade EUR/USD
SPONSORED Discover the top brokers for trading EUR/USD in 2025. Our list features brokers with competitive spreads, fast execution, and powerful platforms. Whether you're a beginner or an expert, find the right partner to navigate the dynamic Forex market.