- Solana price came under pressure after the bulls made new all-time highs for a second week in a row.
- Price action faded quickly to the downside and broke below $221.38.
- With the weekly RSI in oversold territory, SOL price needs a breather before making new highs.
Solana price made new all-time highs by just a few ticks against the previous week's all-time high. Bulls were relatively quick to start book profits and made price action correct quickly by almost 20%. The monthly R1 resistance level does not show any sign of resistance or support to be taken into account, and thus abled bears to run price towards $221.38.
Solana price requires another correction to provide new buyers more upside potential
Solana price was on a perfect bullish candle last week, holding 37% of gains. This week, however, proved to be more challenging for SOL price bulls as Solana price came under pressure by profit-taking at the new all-time highs, and some headwinds popped up as global markets rolled over after higher than expected US inflation prints worrying the markets. With the weekly R1 resistance level not holding any importance, SOL price bears could pair back most of the gains from last week.
SOL price saw a break below $221.38, but that correction did not prove enough to get the weekly Relative Strength Index (RSI) out of the overbought territory. This element will refrain new buyers or current stakeholders from adding more positions to their Solana holdings. Solana price would need to correct further to the downside towards the green ascending trend line near $185 to have the RSI in more neutral territory.
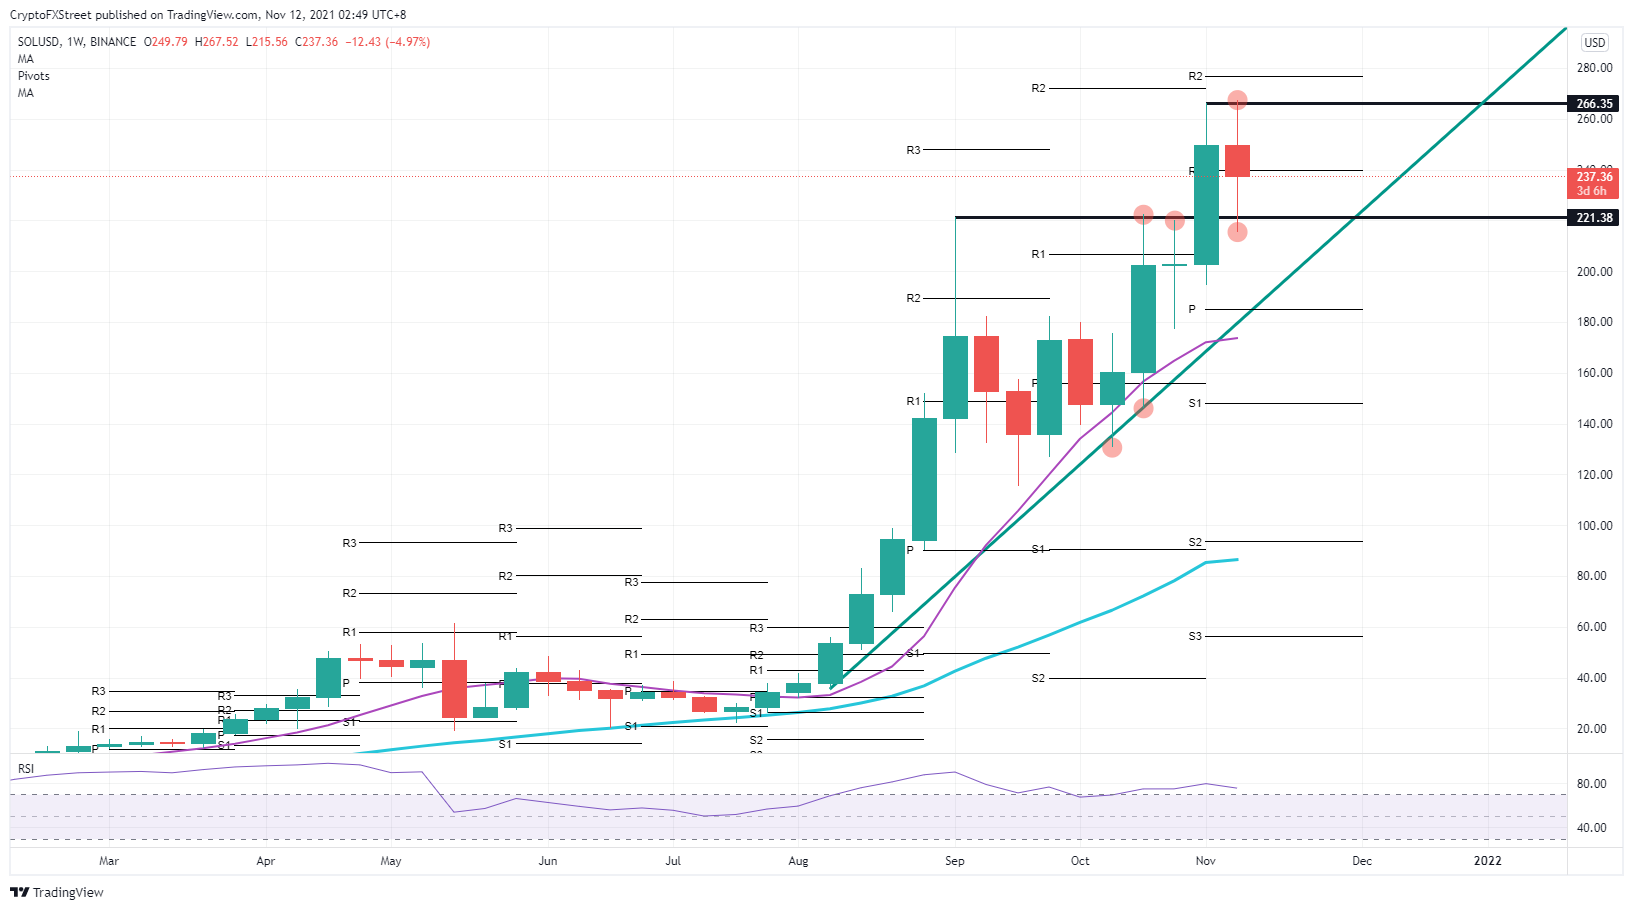
SOL/USD weekly chart
When SOL price would trade around the green ascending trend line, and the monthly pivot at $185.00 comes into the picture, SOL price bulls will have three incentives to get long Solana price again, as the RSI will be in their favor as well. Should bears be able to break below the green ascending trend line, expect the 55-day Simple Moving Average to give additional support near $175.00.
Information on these pages contains forward-looking statements that involve risks and uncertainties. Markets and instruments profiled on this page are for informational purposes only and should not in any way come across as a recommendation to buy or sell in these assets. You should do your own thorough research before making any investment decisions. FXStreet does not in any way guarantee that this information is free from mistakes, errors, or material misstatements. It also does not guarantee that this information is of a timely nature. Investing in Open Markets involves a great deal of risk, including the loss of all or a portion of your investment, as well as emotional distress. All risks, losses and costs associated with investing, including total loss of principal, are your responsibility. The views and opinions expressed in this article are those of the authors and do not necessarily reflect the official policy or position of FXStreet nor its advertisers. The author will not be held responsible for information that is found at the end of links posted on this page.
If not otherwise explicitly mentioned in the body of the article, at the time of writing, the author has no position in any stock mentioned in this article and no business relationship with any company mentioned. The author has not received compensation for writing this article, other than from FXStreet.
FXStreet and the author do not provide personalized recommendations. The author makes no representations as to the accuracy, completeness, or suitability of this information. FXStreet and the author will not be liable for any errors, omissions or any losses, injuries or damages arising from this information and its display or use. Errors and omissions excepted.
The author and FXStreet are not registered investment advisors and nothing in this article is intended to be investment advice.
Recommended Content
Editors’ Picks

Crypto fraud soars as high-risk addresses on Ethereum, TRON networks receive $278 billion
The cryptocurrency industry is growing across multiple facets, including tokenized real-world assets, futures and spot ETFs, stablecoins, Artificial Intelligence (AI), and its convergence with blockchain technology, as well as the dynamic decentralized finance (DeFi) sector.

Bitcoin eyes $100,000 amid Arizona Reserve plans, corporate demand, ETF inflows
Bitcoin price is stabilizing around $95,000 at the time of writing on Tuesday, and a breakout suggests a rally toward $100,000. The institutional and corporate demand supports a bullish thesis, as US spot ETFs recorded an inflow of $591.29 million on Monday, continuing the trend since April 17.

Meme coins to watch as Bitcoin price steadies
Bitcoin price hovers around $95,000, supported by continued spot BTC ETFs’ inflows. Trump Official is a key meme coin to watch ahead of a stakeholder dinner to be attended by President Donald Trump. Dogwifhat price is up 47% in April and looks set to post its first positive monthly returns this year.

Cardano Lace Wallet integrates Bitcoin, boosting cross-chain capabilities
Cardano co-founder Charles Hoskinson announced Monday that Bitcoin is integrated into the Lace Wallet, expanding Cardano’s ecosystem and cross-chain capabilities. This integration enables users to manage BTC alongside Cardano assets, providing support for multichain functionality.
Bitcoin Weekly Forecast: BTC consolidates after posting over 10% weekly surge
Bitcoin (BTC) price is consolidating around $94,000 at the time of writing on Friday, holding onto the recent 10% increase seen earlier this week.

The Best brokers to trade EUR/USD
SPONSORED Discover the top brokers for trading EUR/USD in 2025. Our list features brokers with competitive spreads, fast execution, and powerful platforms. Whether you're a beginner or an expert, find the right partner to navigate the dynamic Forex market.