Solana price hints $400 is imminent as institutions dump ETH for SOL
- Solana price is consolidating under the $216 resistance level, anticipating an 88% breakout.
- SOL appears to be institutions’ favorite as they keep pouring money into it week over week.
- A daily close below the $178 support floor will invalidate the bullish thesis.

Solana price shows no signs of weakness as it approaches a crucial barrier. A breakout above this hurdle will set the stage for a massive bull run and a new all-time high for SOL.
Institutions prefer SOL after Bitcoin and Ethereum
CoinShares’ weekly report shows that Bitcoin saw the most love from institutional investors, who poured $268.6 million into it. This development was closely followed by Ethereum, which received $16.6 million of inflows this week.
Interestingly, the Ethereum-killer received only $1.9 million less than ETH, indicating that Solana is quickly becoming a favorite among large investors. Moreover, the month-to-date inflows for SOL stand around $36.4 million, surpassing that of ETH, which saw an outflow of $0.7 million. This data indicates that institutional investors loaded up on SOL in October while reducing their ETH allocation.
Although altcoins like Cardano, Polkadot, Bitcoin Cash and other assets made the list, their inflows were not on par with Solana, Ethereum or the big crypto.
The CoinShares report stated,
Digital asset investment products saw inflows totalling US$288m last week, bringing the total inflows year-to-date to a record US$8.7bn, already 30% higher than the total for 2020.
This sudden burst in institutional interest for crypto makes sense as it comes in the last quarter of 2021, where the cryptocurrency markets typically see an explosive move.
Solana price ready to rip
Solana price has been consolidating under the $216 resistance level for roughly two months. During this period, SOL has created two rounded bottoms of sorts. The first one with a swing low at $115 and the second one at $175. A trend line can be drawn connecting the peaks of these rounded bottoms at $216, resulting in the formation of a cup and handle.
This technical formation forecasts an 88% upswing to $407, obtained by adding the distance between the bottom of the cup and the cup’s peak on the right to the breakout point at $216.
However, this ascent will come into action if Solana price manages to produce a decisive daily close above $216 and flip it into a support level by retesting it successfully. Doing so will confirm a move to $407 with a pitstop at the 100% Fibonacci extension level at $310.
In some cases, Solana price could extend its run-up to the next barrier at $430.
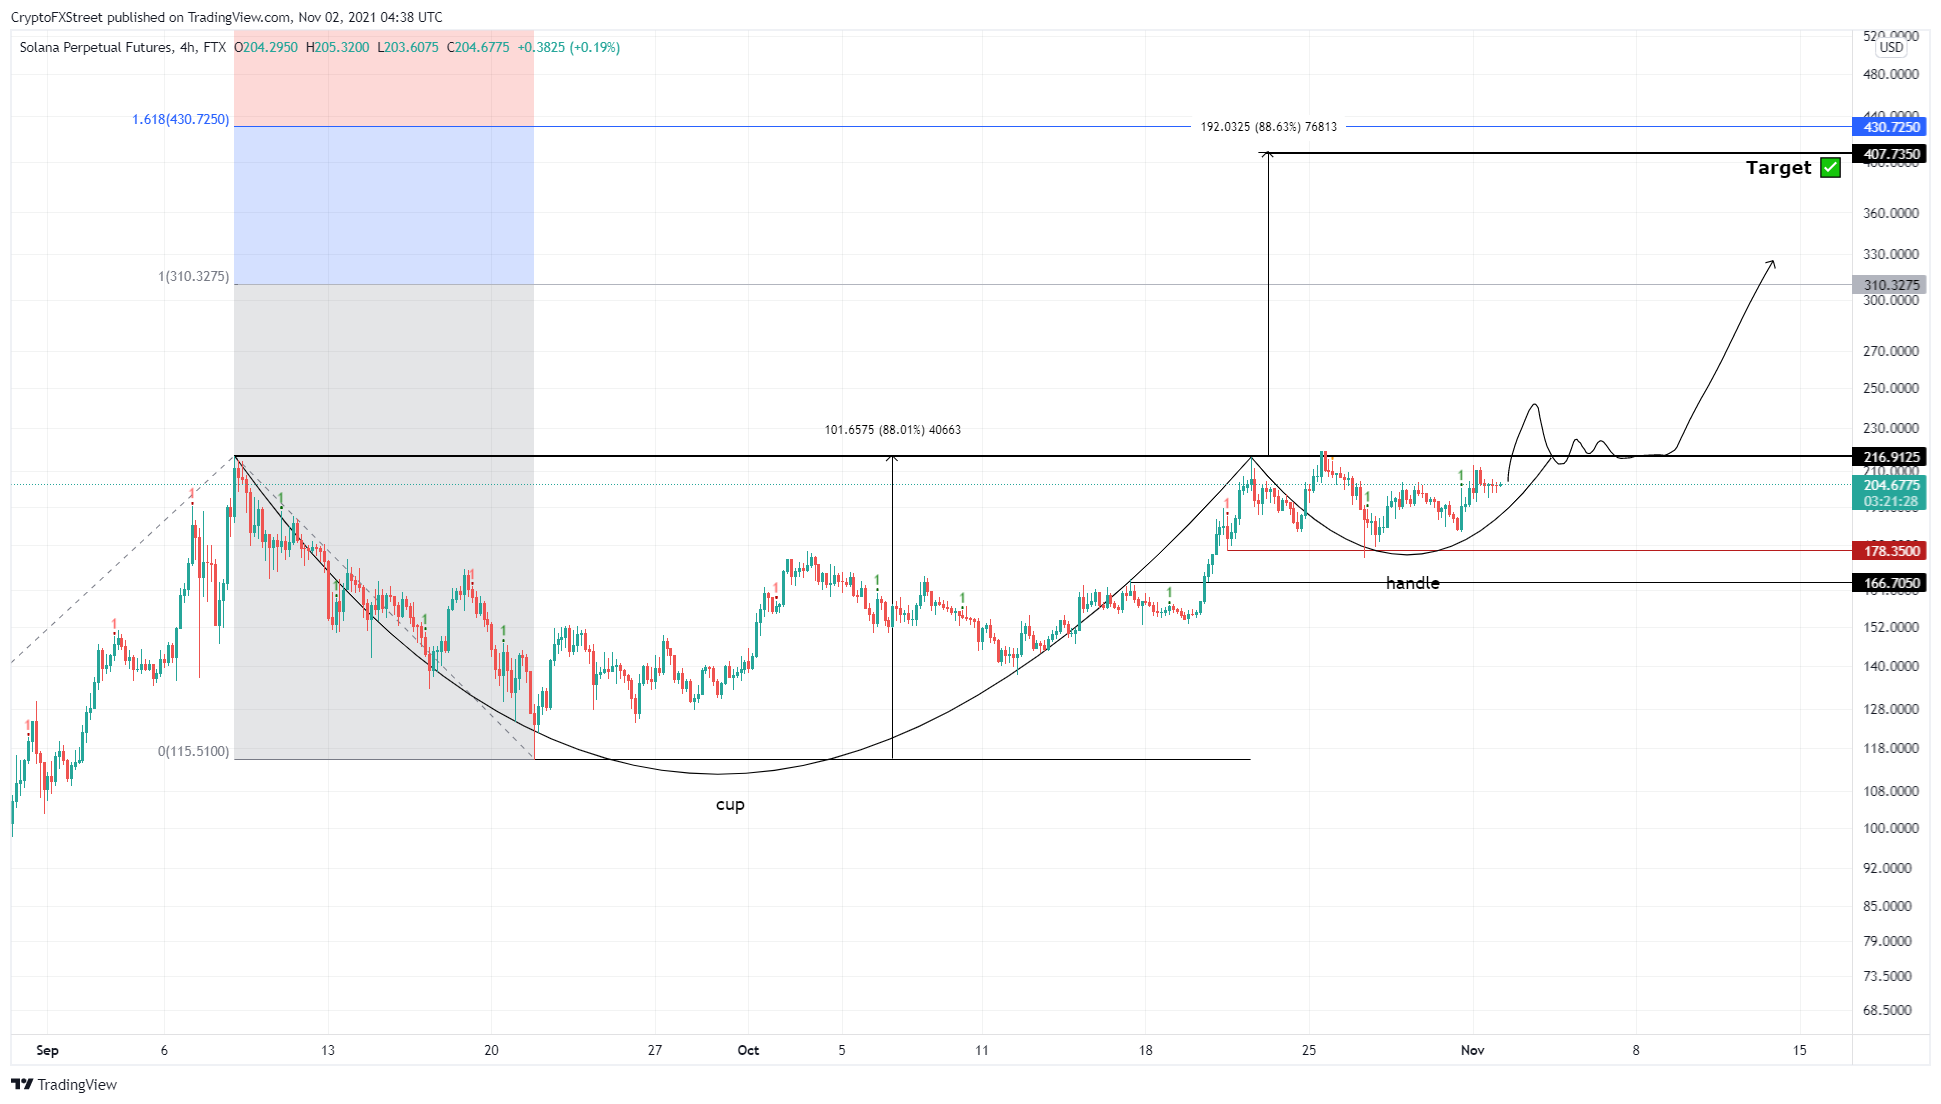
SOL/USDT 1-day chart
On the other hand, if Solana price fails to breach the $216 resistance barrier, it will indicate that the consolidation part, aka the handle, will take time to form. While this is not bearish, it will allow the buyers another chance to push SOL higher.
A daily close below $178 will create a lower low and invalidate the bullish thesis for Solana price. In this situation, SOL will likely dip to the $166 support level. Here, it will make another attempt to run through the $216 hurdle.
Author

Akash Girimath
FXStreet
Akash Girimath is a Mechanical Engineer interested in the chaos of the financial markets. Trying to make sense of this convoluted yet fascinating space, he switched his engineering job to become a crypto reporter and analyst.


