- Solana price sees bulls defending $90 with a technical handle as an anchor point.
- SOL price could be set for a rally of enormous magnitude, holding 50% gains.
- Expect to see tail risks diminishing over the weekend, offering a window of opportunity for SOL price to cover a large portion of ground to the upside.
Solana (SOL) price has been on the back foot for two consecutive weeks. Although the earning season is rocking the boat quite a fair bit, SOL looks set to eke out gains for this week, where a weekly close above the 55-day Simple Moving Average would be ideal. If investors can sit on their hands, SOL price could get pumped in a rally towards $146, holding 50% gains.
SOL price set to cut like a knife through butter towards $150
Solana price saw its rally in March, being almost wholly paired back in the first weeks of April. Bulls are planning, however, not to let it come that far. Eagerly defending $90.23, the 55-day SMA at $100 is being used as an anchor point where buyers and sellers are in a distribution phase, where bulls then get to sit on their hands and see price action ramp up higher with bears desperate to sell and looking for the highest price where finally some bulls are willing to sell.
SOL price thus is in a scenario that favours the bulls in this technical play. Even jumping in now for that trade still makes sense; with a stop below $0.90, a trader only has to give up roughly $10, and when SOL price rallies towards $150, your trading book will have made 50$ return in a 1-to-5 risk-reward ratio which is very lucrative. If the rally has much more legs beyond $150, it is doubtful that the death cross and the 200-day SMA at $146 will put a drag on the rally for the short term.
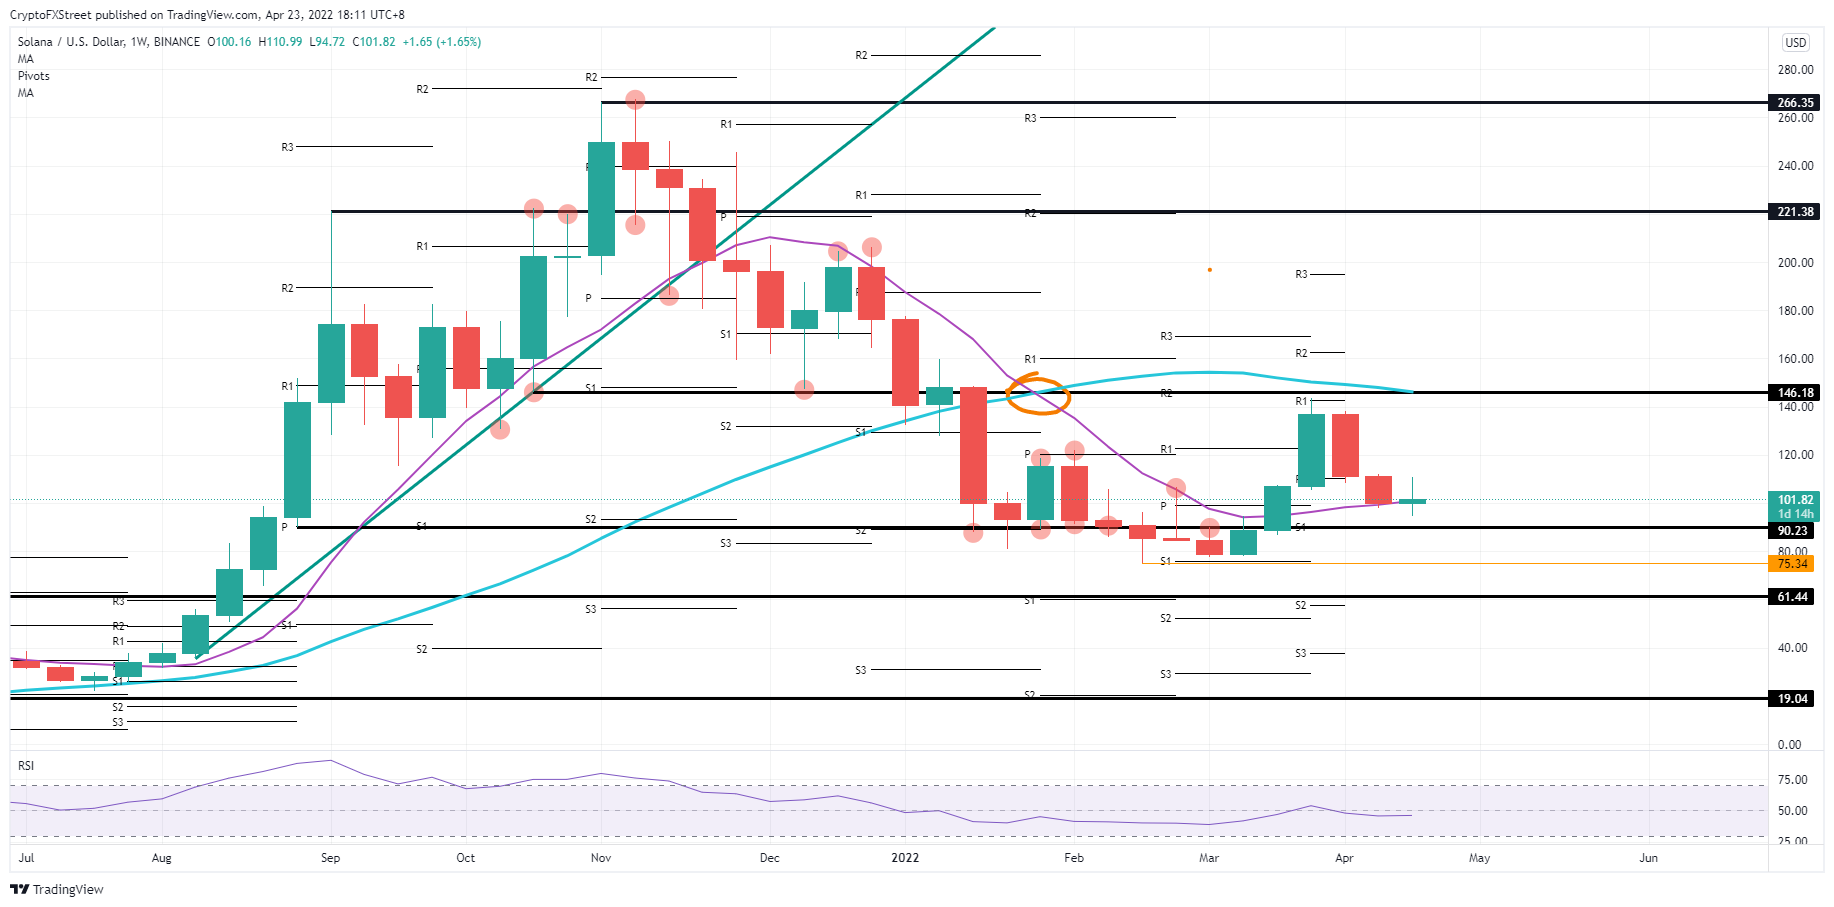
SOL/USD weekly chart
Solana bulls could get entrenched on that $90.23, with bears further shorting massively the price action. That could result in a long squeeze with bulls being stopped out, sell-side volume exploding and creating a nose dive move towards $75.34 or even $61.44, depending on the volume. Luckily the Relative Strenght Index is already below 40. Thus, not much room is offered for another downturn, as by then, the RSI will be trading in ‘oversold.’
Information on these pages contains forward-looking statements that involve risks and uncertainties. Markets and instruments profiled on this page are for informational purposes only and should not in any way come across as a recommendation to buy or sell in these assets. You should do your own thorough research before making any investment decisions. FXStreet does not in any way guarantee that this information is free from mistakes, errors, or material misstatements. It also does not guarantee that this information is of a timely nature. Investing in Open Markets involves a great deal of risk, including the loss of all or a portion of your investment, as well as emotional distress. All risks, losses and costs associated with investing, including total loss of principal, are your responsibility. The views and opinions expressed in this article are those of the authors and do not necessarily reflect the official policy or position of FXStreet nor its advertisers. The author will not be held responsible for information that is found at the end of links posted on this page.
If not otherwise explicitly mentioned in the body of the article, at the time of writing, the author has no position in any stock mentioned in this article and no business relationship with any company mentioned. The author has not received compensation for writing this article, other than from FXStreet.
FXStreet and the author do not provide personalized recommendations. The author makes no representations as to the accuracy, completeness, or suitability of this information. FXStreet and the author will not be liable for any errors, omissions or any losses, injuries or damages arising from this information and its display or use. Errors and omissions excepted.
The author and FXStreet are not registered investment advisors and nothing in this article is intended to be investment advice.
Recommended Content
Editors’ Picks

President Trump's memecoin leads crypto unlock with incoming supply pressure of over $320 million
Official Trump, launched by President Trump, will unlock over $320 million worth of its tokens to team members next week despite the dominant risk-off sentiment across the crypto market.

Bitcoin and crypto market sees recovery as Fed official says agency ready to stabilize market if necessary
Bitcoin rallied 5% on Friday, trading just below $84,000 following Susan Collins, head of the Boston Federal Reserve, hinting that the agency could stabilize markets with "various tools" if needed.

Bitcoin, Ethereum and XRP steady as China slaps 125% tariff on US, weekend sell-off looming?
The cryptocurrency market shows stability at the time of writing on Friday, with Bitcoin holding steady at $82,584, Ethereum at $1,569, and Ripple maintaining its position above $2.00.

Bitcoin, Ethereum, Dogecoin and Cardano stabilze – Why crypto is in limbo
Crypto traders are digesting US President Donald Trump’s Liberation Day announcements last week, the tariff truce declared on Wednesday and the worsening situation with China, as the industry wraps one of its worst weeks in terms of price swings.

Bitcoin Weekly Forecast: Market uncertainty lingers, Trump’s 90-day tariff pause sparks modest recovery
Bitcoin (BTC) price extends recovery to around $82,500 on Friday after dumping to a new year-to-date low of $74,508 to start the week. Market uncertainty remains high, leading to a massive shakeout, with total liquidations hitting $2.18 billion across crypto markets.

The Best brokers to trade EUR/USD
SPONSORED Discover the top brokers for trading EUR/USD in 2025. Our list features brokers with competitive spreads, fast execution, and powerful platforms. Whether you're a beginner or an expert, find the right partner to navigate the dynamic Forex market.