Solana price today: $175.77
- Solana price hit a new all-time high against Ethereum at $0.06922 on Wednesday.
- On-chain analysts at Santiment said SOL price could rally even as crowd sentiment is bearish.
- Solana eyes the psychologically important $180 target in its uptrend.
Solana (SOL) extends its weekly positive move and trades near $175.00 as the altcoin hit a record high against Ethereum (SOL/ETH) on Wednesday at 0.06922.
Solana extends gains after hitting all-time high against Ethereum
Solana rallied to a fresh high against Ethereum (ETH) on Wednesday. SOL is considered one of the leading competitors of Ether’s smart contract blockchain. It is therefore a key development for SOL traders that SOL/ETH hit a new all-time high.
A technical analyst (behind the X handle @KarenZh30739159)at Foresight News identified what differentiates Solana from Ethereum and explained the reason for SOL’s price rally as Ethereum hovers around $2,600. Ethereum expanded its ecosystem through Layer 2 and 3 chains as well as alternative scaling solutions. However, in the same time frame, Solana gained popularity through meme coins and new token launches on the chain.
Retail traders and their interest in Solana is likely one of the key factors driving gains in the altcoin.
「价格为王」 or 「长期主义」?
— siri.eth | KarenZ (, ) @karenzh30739159.lens (@KarenZh30739159) October 24, 2024
关于以太坊与Solana之间的角逐,以太坊整个生态主要在探索二层、三层、质押、再质押、互操作性等,其中二层和质押取得的成就有目共睹,将以太坊简单地视为一家公司,可能会忽略其在技术创新、生态构建等方面的优势。但是价格低迷确实给以太坊带来不小的压力。…
On-chain analysts at crypto intelligence tracker Santiment shared their insights about Solana in a recent tweet on X. Analysts highlighted how a bearish sentiment among traders failed to dampen the altcoin’s price trend.
Analysts ask traders to watch out for further gains in SOL even though some investors remain bearish on the token.
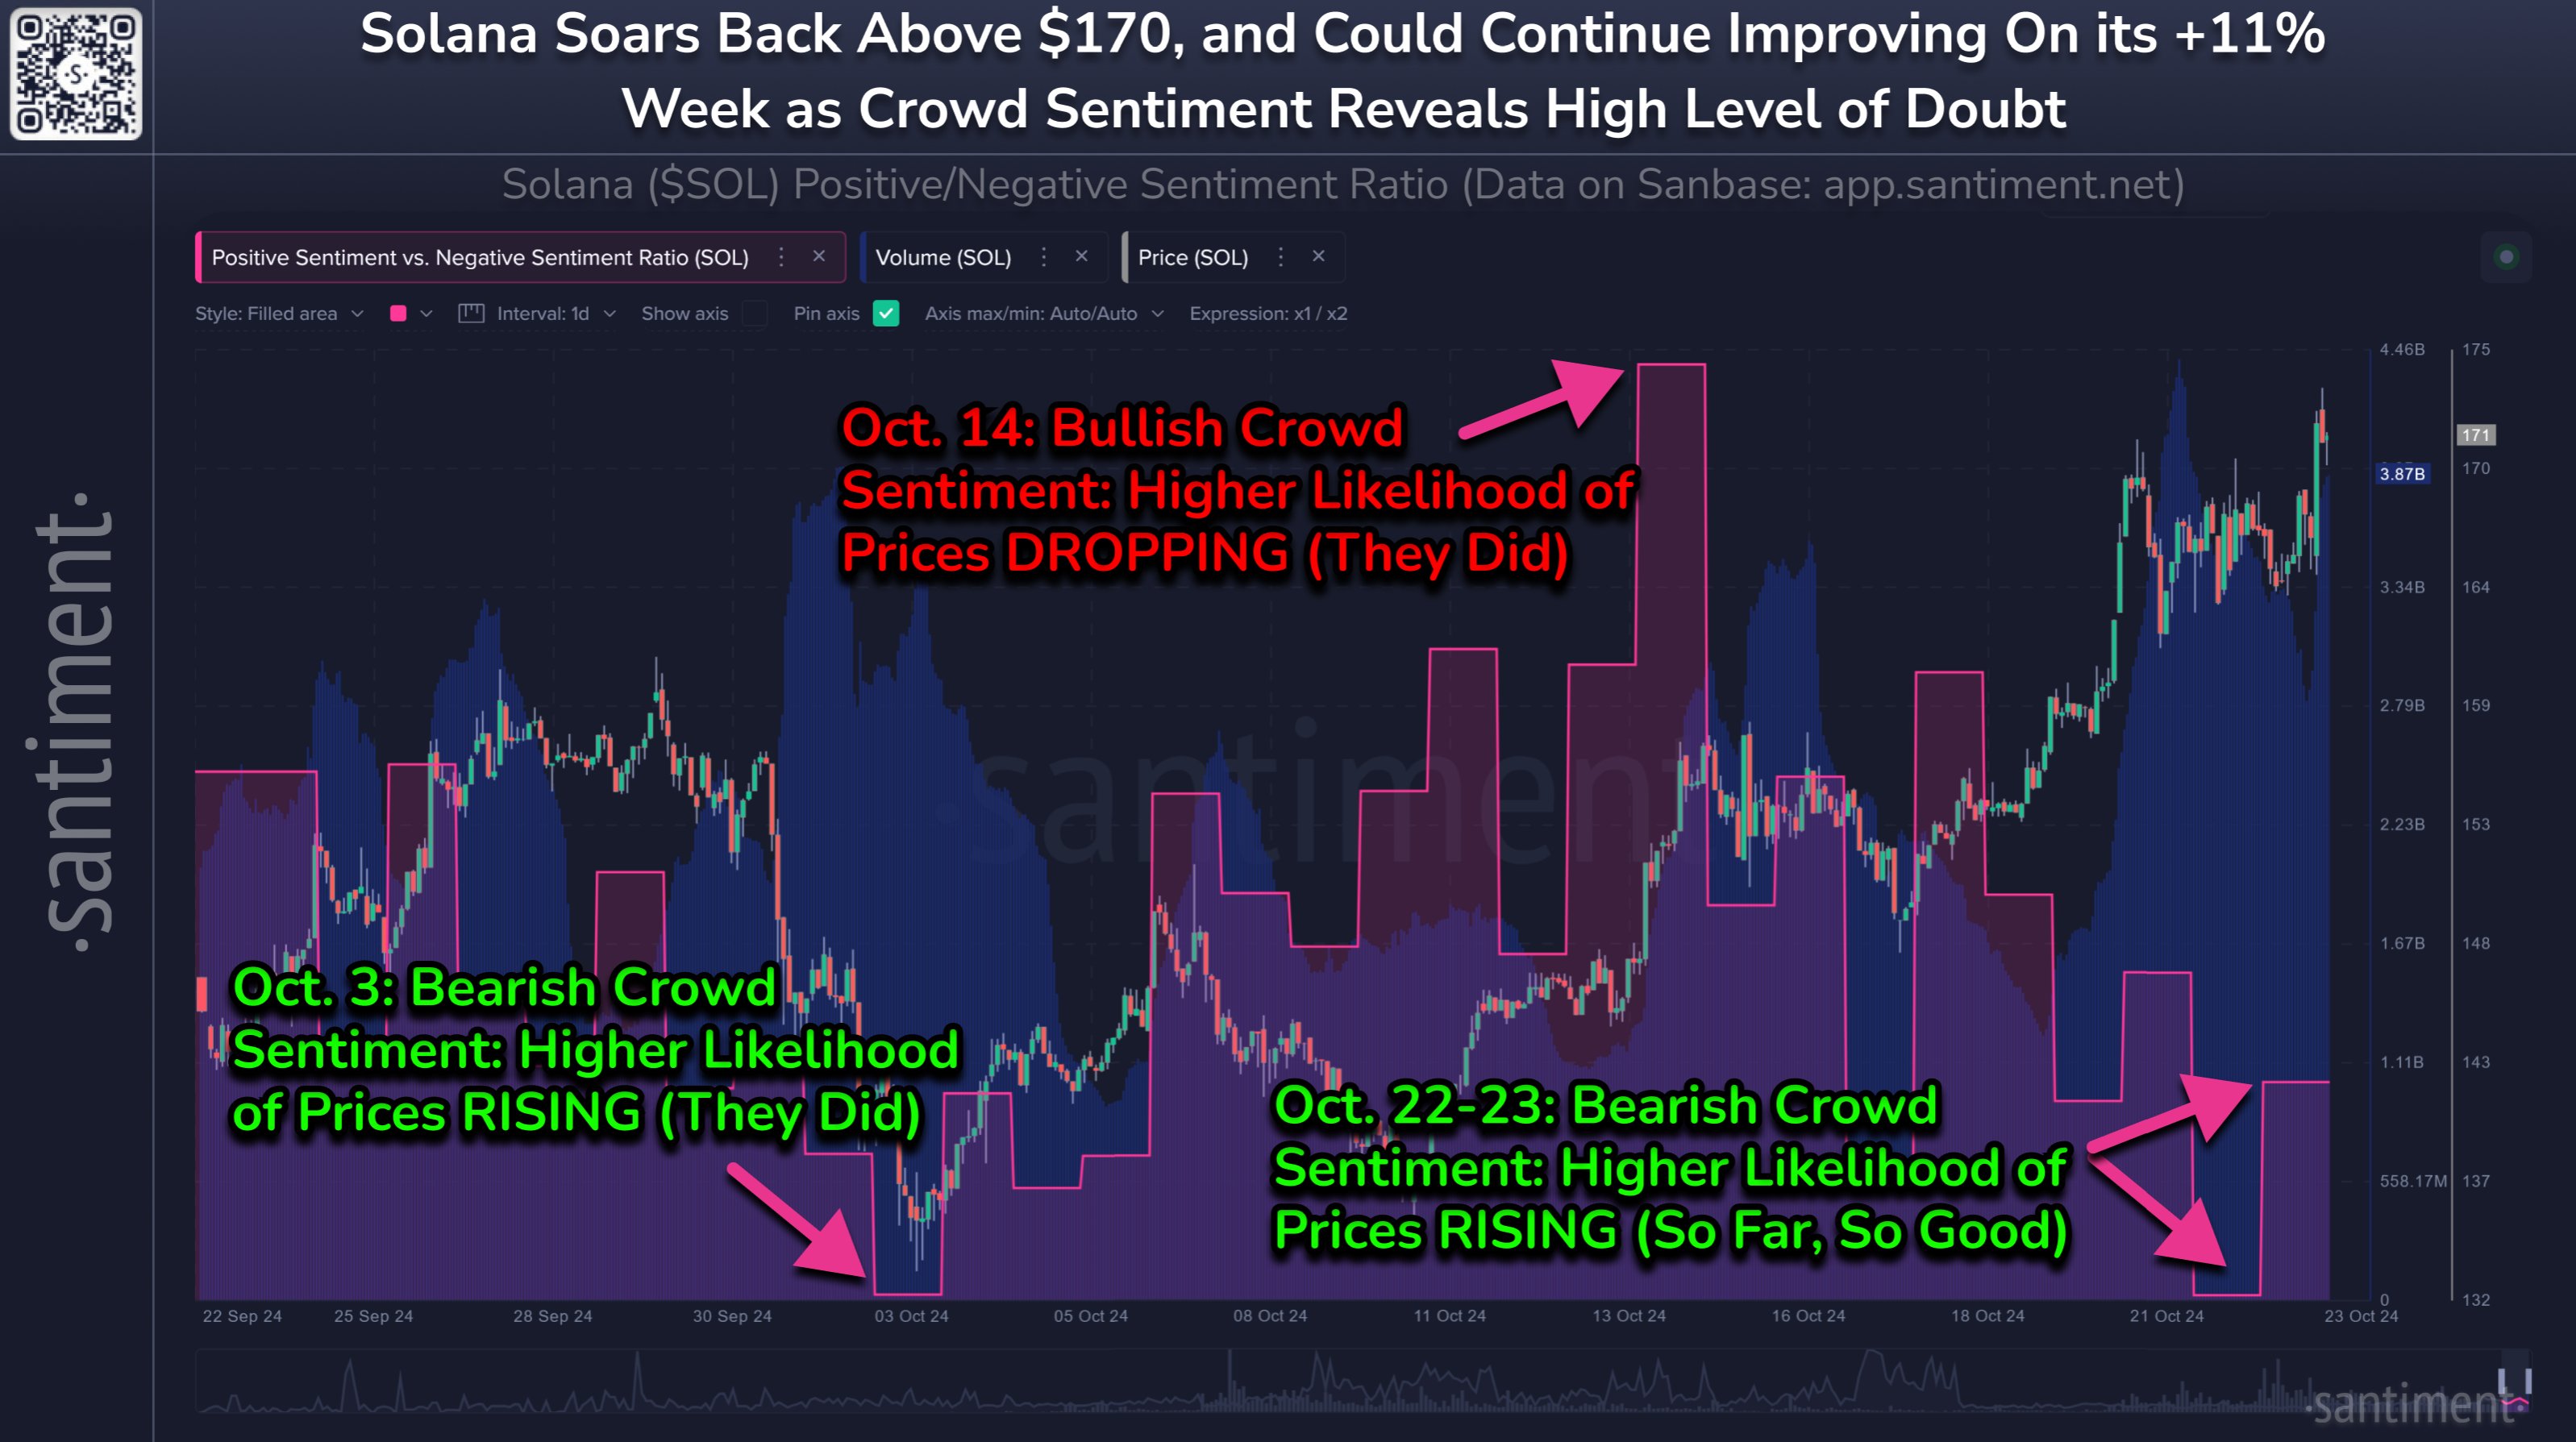
Santiment’s analysis of Solana sentiment and price trend
Solana Price Forecast: SOL eyes 4% gains
Solana trades near $175.77 at the time of writing and targets $180, a psychologically important level for the altcoin. SOL could face immediate resistance in the Fair Value Gap (FVG) between $172.91 and $175.39.
The Moving Average Convergence Divergence (MACD) indicator shows green histogram bars above the neutral level in the daily chart, signalling underlying positive momentum in SOL price trend. However, the Relative Strength Index (RSI) momentum indicator enters overbought conditions just above the 70 level, suggesting traders not to add to their long positions.
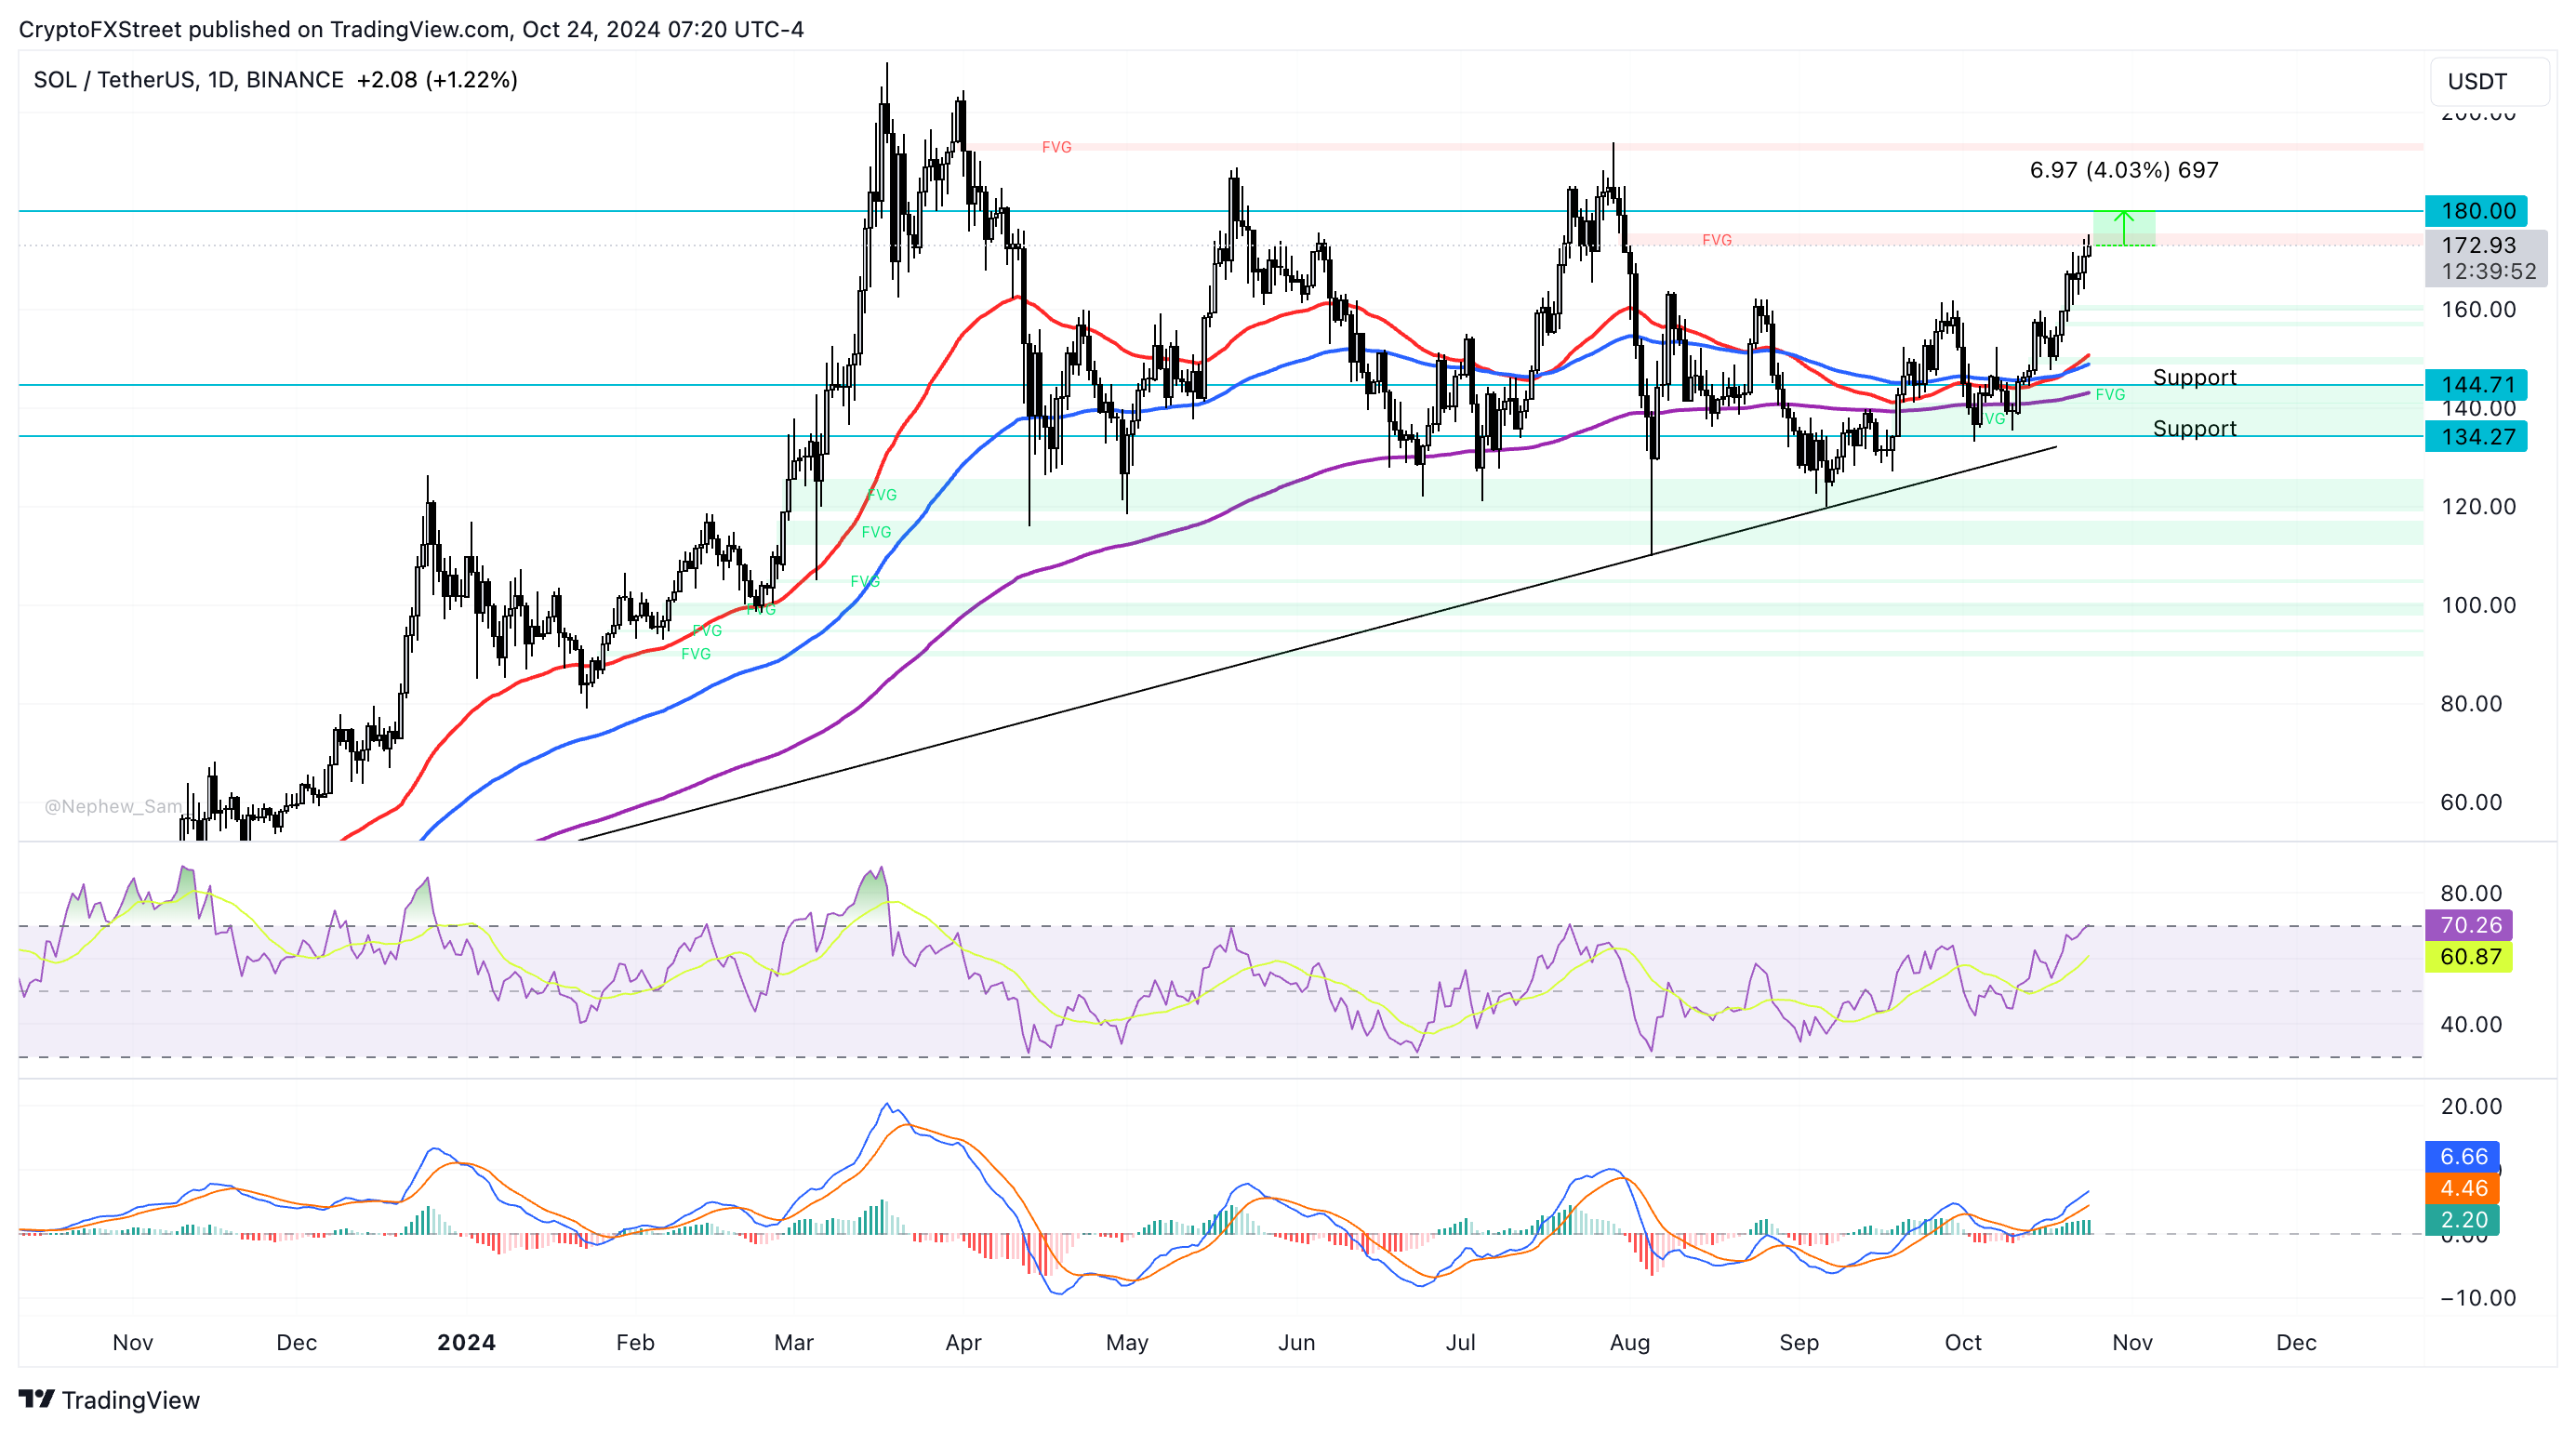
SOL/USDT daily chart
In case of a correction, Solana could find support at the 10-day Exponential Moving Average at $150.74 and the September 19 low, which coincides with a lower boundary of an FVG, at $134.27.
Information on these pages contains forward-looking statements that involve risks and uncertainties. Markets and instruments profiled on this page are for informational purposes only and should not in any way come across as a recommendation to buy or sell in these assets. You should do your own thorough research before making any investment decisions. FXStreet does not in any way guarantee that this information is free from mistakes, errors, or material misstatements. It also does not guarantee that this information is of a timely nature. Investing in Open Markets involves a great deal of risk, including the loss of all or a portion of your investment, as well as emotional distress. All risks, losses and costs associated with investing, including total loss of principal, are your responsibility. The views and opinions expressed in this article are those of the authors and do not necessarily reflect the official policy or position of FXStreet nor its advertisers. The author will not be held responsible for information that is found at the end of links posted on this page.
If not otherwise explicitly mentioned in the body of the article, at the time of writing, the author has no position in any stock mentioned in this article and no business relationship with any company mentioned. The author has not received compensation for writing this article, other than from FXStreet.
FXStreet and the author do not provide personalized recommendations. The author makes no representations as to the accuracy, completeness, or suitability of this information. FXStreet and the author will not be liable for any errors, omissions or any losses, injuries or damages arising from this information and its display or use. Errors and omissions excepted.
The author and FXStreet are not registered investment advisors and nothing in this article is intended to be investment advice.
Recommended Content
Editors’ Picks
Bitcoin Weekly Forecast: New all-time high at $78,900 looks feasible
Bitcoin price declines over 2% this week, but the bounce from a key technical level on the weekly chart signals chances of hitting a new all-time high in the short term. US spot Bitcoin ETFs posted $596 million in inflows until Thursday despite the increased profit-taking activity.
XRP fails to recover even as Ripple files appeal in response to SEC's move
Ripple price has been range bound between $0.5666 and $0.5068 since October 3. Over the past 20 days, XRP has traded within the range even as the SEC vs. Ripple lawsuit sees new developments.
Ethereum Price Forecast: ETH declines below $2,500 as demand fades
Ethereum price is nearing its daily support level of $2,461; a firm close below this level would suggest a decline ahead. Coinbase Premium Index shows signs of weakness and remains below neutral levels.
Top 3 Price Prediction Bitcoin, Ethereum, Ripple: BTC shows signs of recovery
Bitcoin has found support at the key $66,000 level, suggesting a potential recovery. However, Ethereum and Ripple prices are struggling below their critical support levels, indicating a possible continuation of their downtrends.
Bitcoin: New all-time high at $78,900 looks feasible
Bitcoin (BTC) trades slightly down at around $67,500 on Friday after finding support around the $66,000 level on Wednesday, following three consecutive days of decline earlier in the week.
Best Forex Brokers with Low Spreads
VERIFIED Low spreads are crucial for reducing trading costs. Explore top Forex brokers offering competitive spreads and high leverage. Compare options for EUR/USD, GBP/USD, USD/JPY, and Gold.