- Solana price is traversing a descending parallel channel, hinting at gains after a bullish breakout.
- Due to the recent mishap, a breakdown of the $152 support floor could trigger a sell-off.
- In a highly bearish case, SOL might drop as low as $108.37.
Solana price has been on a steady downtrend over the past week and shows no signs of slowing down. As SOL approaches a crucial support floor, the buyers and sellers are posed with a make-or-break decision.
Solana price prepares for a bullish breakout
Solana price has dropped roughly 26% to where it currently trades, $156.52. During this descent, SOL has set up four swing highs and three swing lows. Connecting these swing points using trend lines shows the formation of a descending parallel channel.
A decisive close above the upper trend line of the technical formation at $169.79 indicates a bullish breakout. In this case, investors can expect SOL to rally 11% before encountering the $188.88 resistance barrier.
If the buying pressure persists, Solana price is likely to flip this hurdle into a platform. A successful close above $188.88 will put the $194.22 and $199.23 supply barriers in view of the bulls.
Due to massive congesting on its way down, clearing these blockades could exhaust the buying pressure and slow down the uptrend. Therefore, investors should pay close attention to $199.23 or the $200 psychological level.
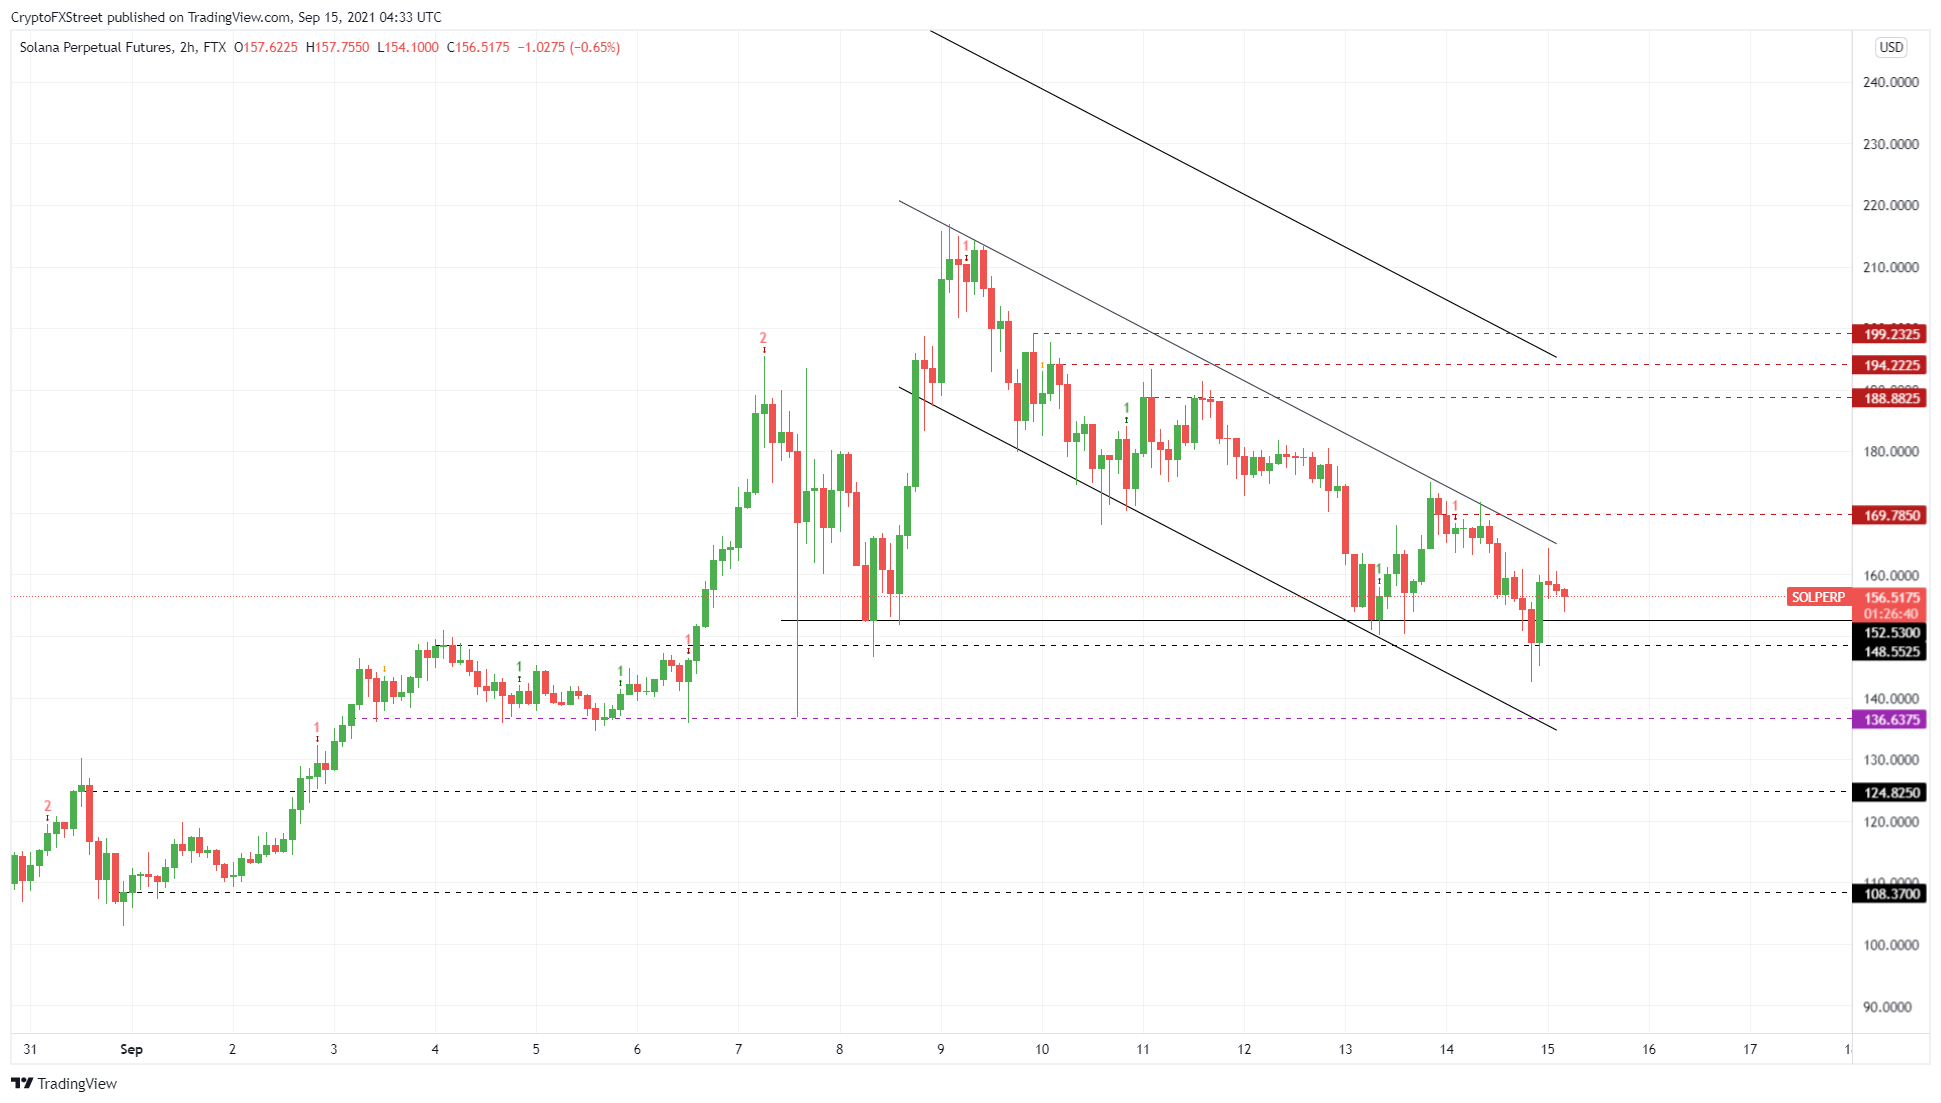
SOL/USDT 2-hour chart
While descending parallel channels have a higher probability of breaking bullish, the optimistic scenario above makes sense. However, if Solana price fails to keep above the $148.55 support floor, it will form a lower low.
This development will scare investors away as it could indicate the continuation of the downtrend. However, if SOL breaches below the $136.64, it will seal the bullish fate and have a high probability of pushing Solana price to $124.83 or, in a highly bearish case, $108.37.
Information on these pages contains forward-looking statements that involve risks and uncertainties. Markets and instruments profiled on this page are for informational purposes only and should not in any way come across as a recommendation to buy or sell in these assets. You should do your own thorough research before making any investment decisions. FXStreet does not in any way guarantee that this information is free from mistakes, errors, or material misstatements. It also does not guarantee that this information is of a timely nature. Investing in Open Markets involves a great deal of risk, including the loss of all or a portion of your investment, as well as emotional distress. All risks, losses and costs associated with investing, including total loss of principal, are your responsibility. The views and opinions expressed in this article are those of the authors and do not necessarily reflect the official policy or position of FXStreet nor its advertisers. The author will not be held responsible for information that is found at the end of links posted on this page.
If not otherwise explicitly mentioned in the body of the article, at the time of writing, the author has no position in any stock mentioned in this article and no business relationship with any company mentioned. The author has not received compensation for writing this article, other than from FXStreet.
FXStreet and the author do not provide personalized recommendations. The author makes no representations as to the accuracy, completeness, or suitability of this information. FXStreet and the author will not be liable for any errors, omissions or any losses, injuries or damages arising from this information and its display or use. Errors and omissions excepted.
The author and FXStreet are not registered investment advisors and nothing in this article is intended to be investment advice.
Recommended Content
Editors’ Picks

Shiba Inu Price Forecast: SHIB holders unload 61.5 billion tokens in the last ten days
Shiba Inu (SHIB) price is hovering around $0.000013 on Tuesday after dropping nearly 12% the previous day. Supply Distribution data shows that whale wallets have decreased SHIB holdings in the last ten days.

XRP eyes further downside as Trump to implement tariffs on Mexico, Canada, in March
Ripple's XRP joined the wider crypto market decline, plunging nearly 10% on Monday following President Donald Trump reiterating that the US will kick off tariffs on Mexico and Canada.

Raydium drops 35% on speculation of PumpFun’s Automated Market Maker development
Raydium (RAY) price trades around $3 on Tuesday after dropping almost 35% the previous day. This price crash was due to the rumors of a competing Automated Market Maker being developed by PumpFun and losing $334 million in market capitalization

Crypto Today: USDC approved in Dubai, SOL, ETH and BTC in turmoil, as Trump tariffs spark $200B losses
Cryptocurrency markets declined 7% on Monday, as cascading $208 billion liquidations shaved $80 billion off the sector’s aggregate valuation.

Bitcoin: BTC demand and liquidity conditions remain weak
Bitcoin price has been consolidating between $94,000 and $100,000 since early February, hovering around $98,000 at the time of writing on Friday. Despite this consolidation, US Bitcoin spot ETFs data recorded a total net outflow of $489.60 million until Thursday, hinting signs of weakness among institutional investors.

The Best brokers to trade EUR/USD
SPONSORED Discover the top brokers for trading EUR/USD in 2025. Our list features brokers with competitive spreads, fast execution, and powerful platforms. Whether you're a beginner or an expert, find the right partner to navigate the dynamic Forex market.