- Solana price bounced off a significant Fibonacci level.
- Bulls ramped up price action with 18% of profits.
- Another leg higher will hold 20% of additional profits for bulls if they can clear $150 in Solana price action.
Solana (SOL) price was on the downturn on Monday, but bulls have seized on two technical entry points as a reason to pair back losses. With losses almost recovered in total, more upside could offer itself to bulls if buyers can clear the hurdle at $150. The price of Solana could jump to $174.32.
Solana bulls hold the cards at $145 and need to push the price beyond $150 for more upside
Solana price was in a correction phase on Sunday, but price action behaved better than other alt-currencies. Buyers were patient and picked up Solana at an exciting level, proving that technical analysis works and has its fruit to bear. Bulls picked up SOL at $121.67, which is the 50% Fibonacci retracement from the high of September to the low of July. With that, the red descending trend line falls in place as well. This trend line had four tests to the upside before bulls broke above it, and now it is acting as support for the bulls to enter long positions.
SOL price is intraday hitting the 38.2% Fibonacci level at 145.20. Just above the R1 monthly resistance level at $150, bulls will have their work cut out to squeeze sellers out of their attempts to have another run to the downside. This is why SOL must see buyers push the price and preferably keep it above $150. That would attract more buyers and open up the possibility of hitting $174 by the end of this week.
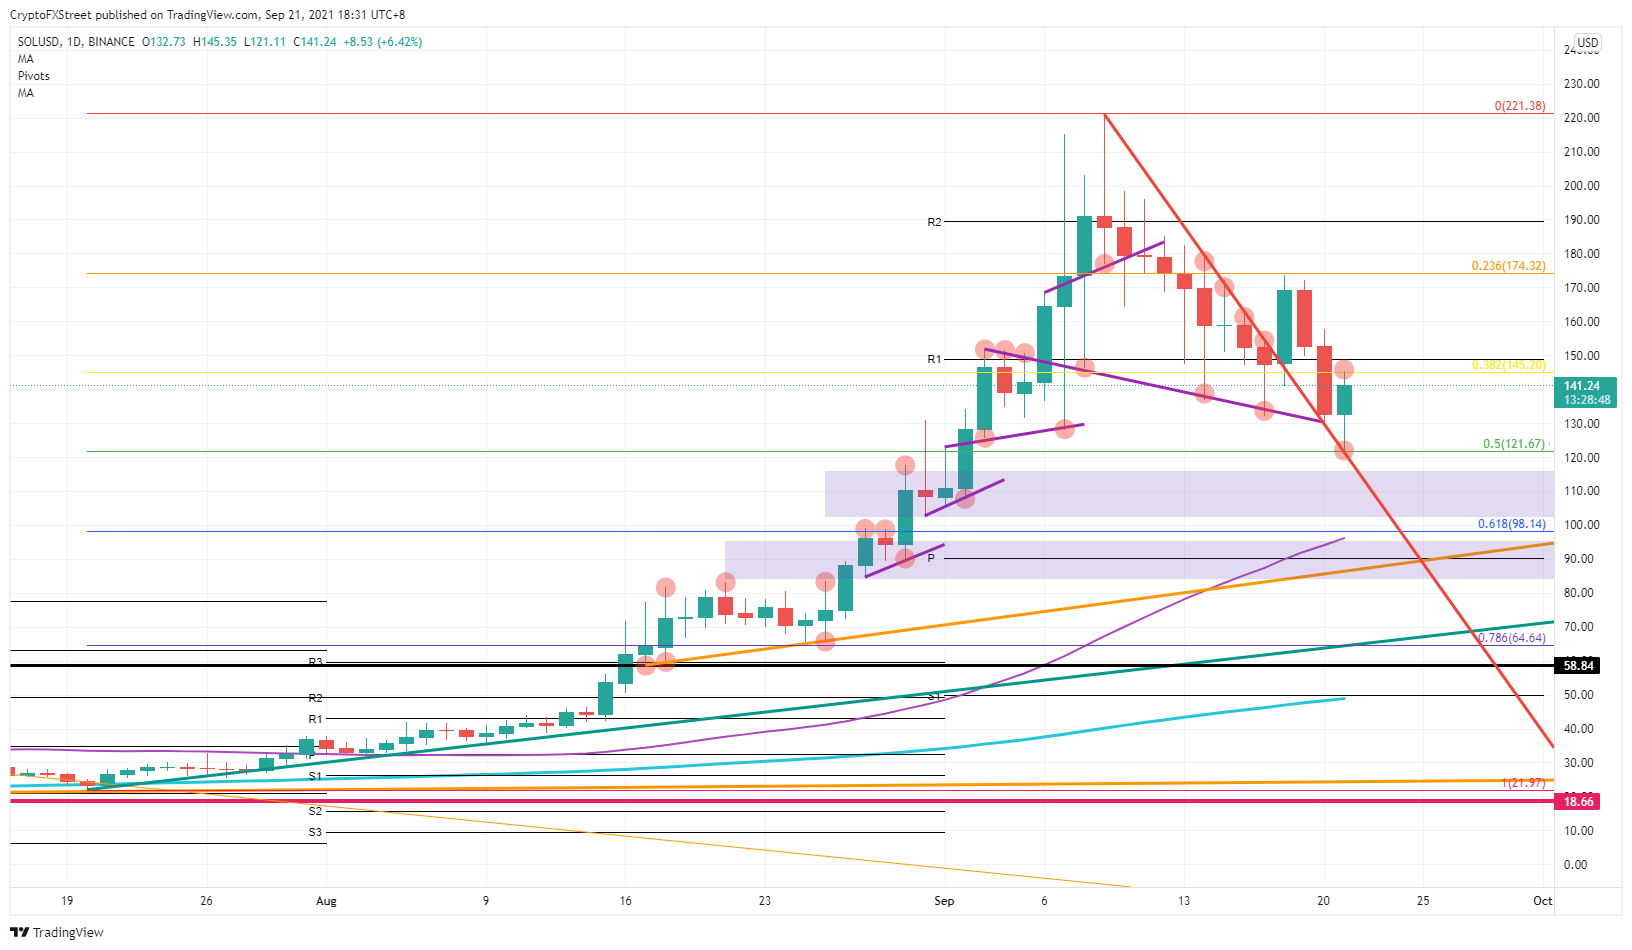
SOL/USD daily chart
Expect Solana price action to try and push beyond $150. Once bulls have gained control, they should stay above that $150 by the end of the trading day. Hesitant buyers will add volume to the rally and probably another 16% to the price action.
With some significant economic agenda events, sentiment could quickly turn 180 degrees and spell more downside pressure for Solana prices. With Evergrande in a possible default on Thursday and the FED FOMC meeting on Wednesday, two significant catalysts could cause some hiccups on the path to more upside. Except, in that case, the Solana price enters below the red descending trend line again and looks to test $98.14, which is the 61.8% Fibonacci level.
Like this article? Help us with some feedback by answering this survey:
Information on these pages contains forward-looking statements that involve risks and uncertainties. Markets and instruments profiled on this page are for informational purposes only and should not in any way come across as a recommendation to buy or sell in these assets. You should do your own thorough research before making any investment decisions. FXStreet does not in any way guarantee that this information is free from mistakes, errors, or material misstatements. It also does not guarantee that this information is of a timely nature. Investing in Open Markets involves a great deal of risk, including the loss of all or a portion of your investment, as well as emotional distress. All risks, losses and costs associated with investing, including total loss of principal, are your responsibility. The views and opinions expressed in this article are those of the authors and do not necessarily reflect the official policy or position of FXStreet nor its advertisers. The author will not be held responsible for information that is found at the end of links posted on this page.
If not otherwise explicitly mentioned in the body of the article, at the time of writing, the author has no position in any stock mentioned in this article and no business relationship with any company mentioned. The author has not received compensation for writing this article, other than from FXStreet.
FXStreet and the author do not provide personalized recommendations. The author makes no representations as to the accuracy, completeness, or suitability of this information. FXStreet and the author will not be liable for any errors, omissions or any losses, injuries or damages arising from this information and its display or use. Errors and omissions excepted.
The author and FXStreet are not registered investment advisors and nothing in this article is intended to be investment advice.
Recommended Content
Editors’ Picks

Crypto Today: Metaplanet raises $10M to buy BTC, ETH price moves below $1,600 as Tron gains signals panic
The cryptocurrency aggregate market capitalization stabilized around $2.7 trillion on Wednesday, with Bitcoin’s $84,000 support momentarily anchoring the market against external bearish discourses.

Chainlink active addresses drop as whale selling spikes, could LINK crash below $10?
Chainlink active addresses slide dramatically to 3,200 from February’s peak of 9,400. The downtrend in network activity coincides with increasing selling activity among whales with between 10 million and 100 million LINK.
Bitcoin stabilizes around $83,000 as China opens trade talks with President Trump’s administration
Bitcoin is stabilizing around $83,500 at the time of writing on Wednesday after facing multiple rejections around the 200-day EMA at $85,000 since Saturday. A breakout of this strong level would indicate a bullish trend ahead.

Binance Chain completes $914M BNB token burn, hinting at a potential rally
Binance Chain has finalized its programmed 31st quarterly BNB token burn, potentially setting the stage for the world’s fifth-largest cryptocurrency, with a market capitalization of $81.45 billion, to rally in the coming weeks.
Bitcoin Weekly Forecast: Market uncertainty lingers, Trump’s 90-day tariff pause sparks modest recovery
Bitcoin (BTC) price extends recovery to around $82,500 on Friday after dumping to a new year-to-date low of $74,508 to start the week. Market uncertainty remains high, leading to a massive shakeout, with total liquidations hitting $2.18 billion across crypto markets.

The Best brokers to trade EUR/USD
SPONSORED Discover the top brokers for trading EUR/USD in 2025. Our list features brokers with competitive spreads, fast execution, and powerful platforms. Whether you're a beginner or an expert, find the right partner to navigate the dynamic Forex market.