Solana price could move 10% north if it stays above this level
- Solana price dropped 12% to find support at $19.15, the mean threshold of a demand zone that currently offering upport.
- SOL could rally 10% to around $22.09 if bullish momentum continues rising.
- Invalidation of the bullish outlook will happen if the altcoin decisively loses the $19.15 support level and tags the $18.41 level.
Solana (SOL) price has been on a steady flow since late August, as the broader market reacted to the US Securities and Exchange Commission (SEC) delaying decisions on spot BTC Exchange-Traded Funds (ETF) applications. Bitcoin price fell almost 7% to trade at $25,821 at the time of writing. For SOL, the slump sent the altcoin around 10% to the current auction price of 19.57.
Also Read: Bitcoin price likely to fall 10% from current levels this September, crypto analyst says.
Solana price nurtures an uptrend
Solana (SOL) price is nurturing an uptrend despite a bearish pull that has seen the altcoin drop around 2% in the last 24 hours. As a side note, crypto exchange FTX has transferred tokens worth more than $10 million from the Solana network to the Ethereum blockchain,. Solana executives urging FTX to distribute these tokens among community members.
#FTX cold wallet: 6b4aypBhH337qSzzkbeoHWzTLt4DjG2aG8GkrrTQJfQA, is transferring funds.
— Ethereum Journal (@EthereumJournal) September 2, 2023
Tokens such as $LINK, $SUSHI, $LUNA, and $YFI on the #Solana are transferred to the #Ethereum through bridges such as #Wormhole. pic.twitter.com/UP4Cts1dvq
As social dominance grows for SOL, the token moves north, with momentum indicators to back it up. Notably, Solana price currently resides within the $19.85 to $19.41 demand zone, which is an order block often characterized by aggressive buying. Increased buying pressure from this zone could send the purported Ethereum killer up 10% to the $22.09 resistance level.
This resistance level is significant for Solana price considering the 100-, 50- and 200-day Exponential Moving Averages (EMA) have populated around it at $21.70, $21.91, and $22.46, respectively. This makes it a dense supplier congestion zone, likely the turnaround point for the anticipated uptrend.
In a highly bullish case, Solana price could break past these resistance levels to retest the July to August highs at around $25.23. Noteworthy, the odds for such an outcome would increase if Bitcoin price shows strength.
Meanwhile, the Relative Strength Index (RSI) is moving up, which points to rising momentum. Similarly, the histogram bars of the Awesome Oscillator are edging toward the midline, adding credence to the upside.
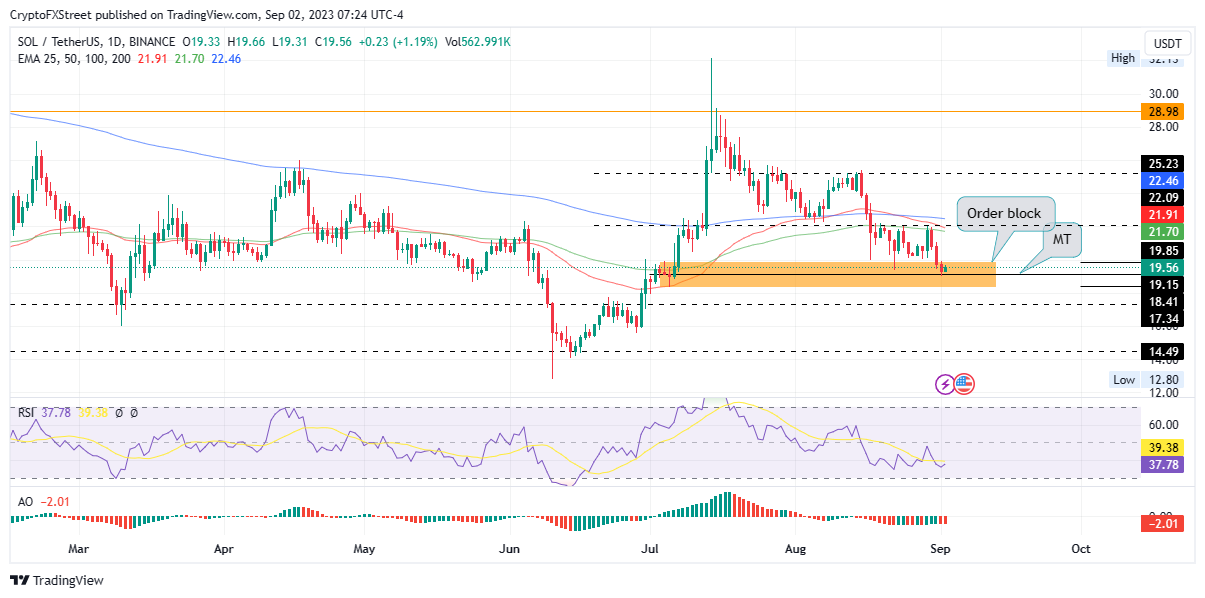
SOL/USDT 1-day chart
Conversely, if Solana price breaks below the midline of the order block, otherwise referred to as the mean threshold at $19.15, the odds would tip in favor of bears. Invalidation of the current bullish thesis would occur if it makes a decisive daily candlestick close below it, potentially tagging the base of the order block at $18.41.
In the dire case, Solana price could drop to the $17.34 support level, or worse, go as low as $14.49, levels last seen around mid-June.
Notably, both momentum indicators are in dangerous zones, the RSI below 50 and the AO in the negative, leaving the SOL market susceptible to a bearish takeover. A drop below $18.41 would make the demand zone a bearish breaker.
Bitcoin, altcoins, stablecoins FAQs
What is Bitcoin?
Bitcoin is the largest cryptocurrency by market capitalization, a virtual currency designed to serve as money. This form of payment cannot be controlled by any one person, group, or entity, which eliminates the need for third-party participation during financial transactions.
What are altcoins?
Altcoins are any cryptocurrency apart from Bitcoin, but some also regard Ethereum as a non-altcoin because it is from these two cryptocurrencies that forking happens. If this is true, then Litecoin is the first altcoin, forked from the Bitcoin protocol and, therefore, an “improved” version of it.
What are stablecoins?
Stablecoins are cryptocurrencies designed to have a stable price, with their value backed by a reserve of the asset it represents. To achieve this, the value of any one stablecoin is pegged to a commodity or financial instrument, such as the US Dollar (USD), with its supply regulated by an algorithm or demand. The main goal of stablecoins is to provide an on/off-ramp for investors willing to trade and invest in cryptocurrencies. Stablecoins also allow investors to store value since cryptocurrencies, in general, are subject to volatility.
What is Bitcoin Dominance?
Bitcoin dominance is the ratio of Bitcoin's market capitalization to the total market capitalization of all cryptocurrencies combined. It provides a clear picture of Bitcoin’s interest among investors. A high BTC dominance typically happens before and during a bull run, in which investors resort to investing in relatively stable and high market capitalization cryptocurrency like Bitcoin. A drop in BTC dominance usually means that investors are moving their capital and/or profits to altcoins in a quest for higher returns, which usually triggers an explosion of altcoin rallies.
Author

Lockridge Okoth
FXStreet
Lockridge is a believer in the transformative power of crypto and the blockchain industry.


