- Solana price fell by 8% from the previous week.
- SOL has yet to retest three significant moving averages during this year's downtrend.
- A breach above last week's trading range is needed to consider a retracement into the breached moving indicators.
Solana price is undergoing a persistent bearish stronghold. Last week's 8% downswing brought the yearly decline to 93%. Now it appears the bears are aiming for new yearly lows.
Solana price in a strong downtrend
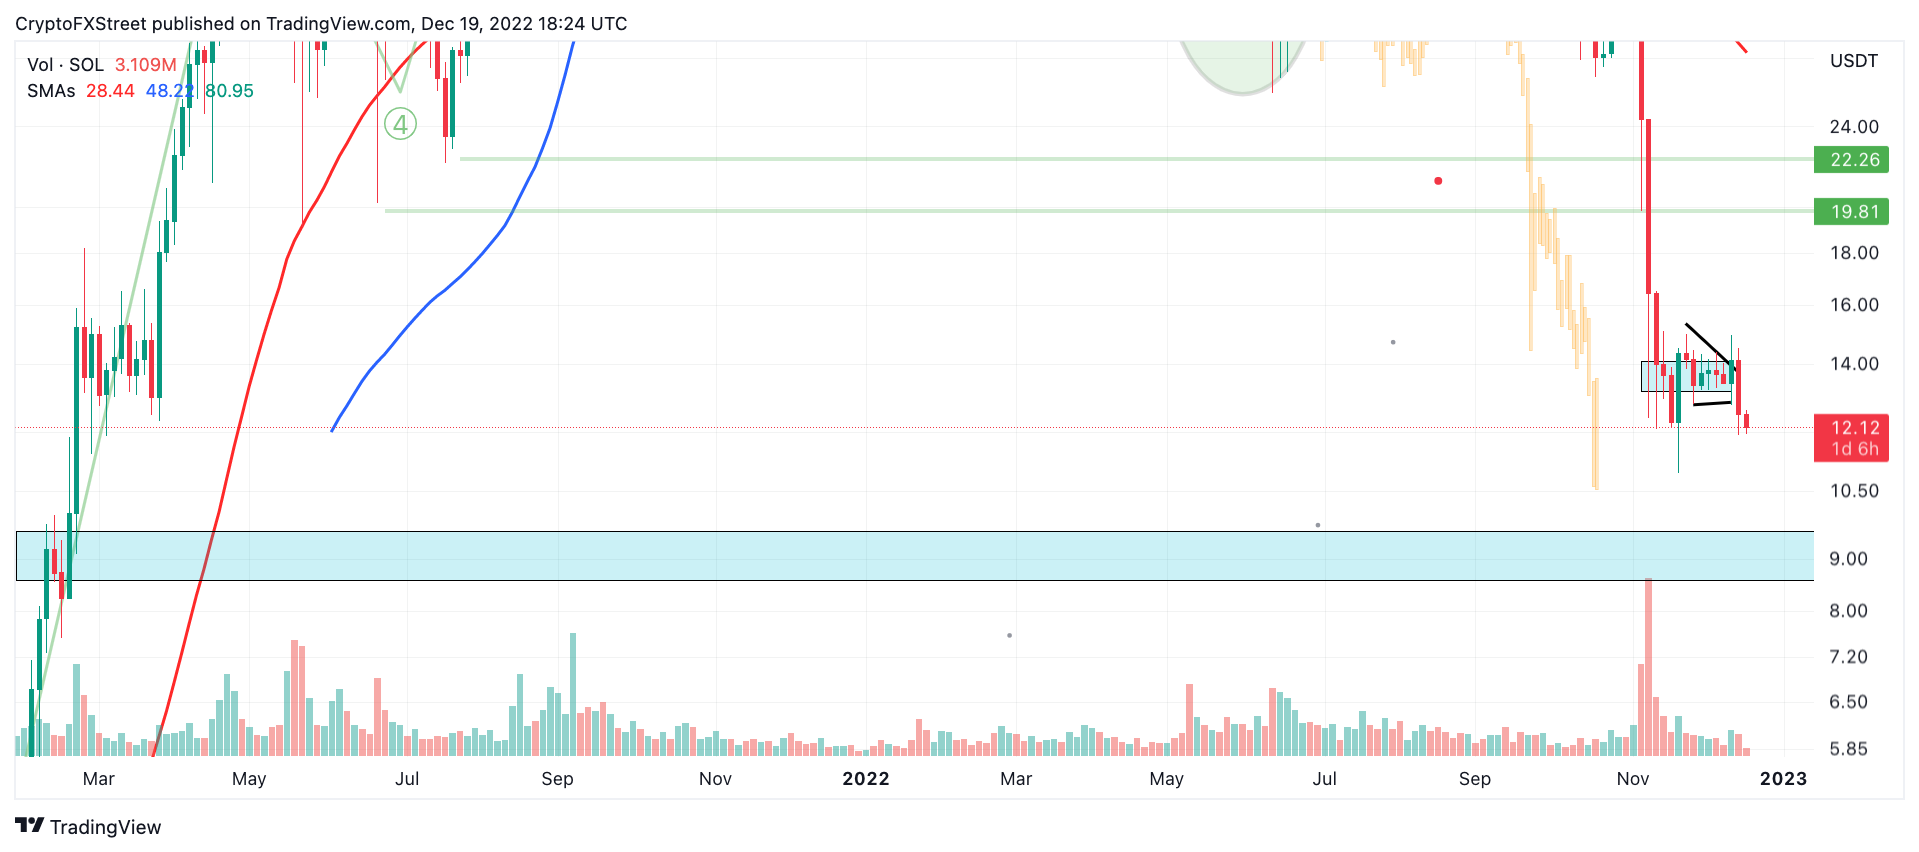
Solana price finally resolved the confusion about SOL's congestive price action witnessed throughout the fall. On December 15, the centralized smart-contract token pierced the south side of the $12-$14 trading range and produced a 10% loss of market value. Solana's price has since struggled to retaliate and gain re-entrance to its' lost levels of support.
The SOL price currently auctions at $12.09. Since the start of the year, SOL has progressively lost interest from bulls hanging out at nearly all expected target zones. At the time of writing, the 50-day, 100-day, and 200-day simple moving averages each hover above SOL's current price. Classical technical analysis would suggest that the Solana price is in a true downtrend, and trying to catch a knife could lead to a lethal loss of capital.
SOL's daily trading price lies 40% beneath the closest simple moving average (the 50-day SMA). The bull's failure to retrace into the aforementioned moving average, following a month-long bout of consolidation, is telling of the bears' underlying strength on the market.
On February 15, during the 2021 bullrun, SOL witnessed a 20% market decline after piercing the $9 barrier. Because SOL hovers just above the newly established yearly lows at $10.94, considering historical key levels is a justified idea for bear market target zones. A breach of the $9 liquidity level would result in a 25% decline from the Solana's market value.
SOL/USST 3-Day Chart
Based on the previous bearish outlook, A break above the previous week's swing high is needed to consider aiming for higher bullish targets. A hurdle above the level would invalidate the bearish bias creating the possibility for a spike into the 50-day SMA at $17 for a 40% gain.
Information on these pages contains forward-looking statements that involve risks and uncertainties. Markets and instruments profiled on this page are for informational purposes only and should not in any way come across as a recommendation to buy or sell in these assets. You should do your own thorough research before making any investment decisions. FXStreet does not in any way guarantee that this information is free from mistakes, errors, or material misstatements. It also does not guarantee that this information is of a timely nature. Investing in Open Markets involves a great deal of risk, including the loss of all or a portion of your investment, as well as emotional distress. All risks, losses and costs associated with investing, including total loss of principal, are your responsibility. The views and opinions expressed in this article are those of the authors and do not necessarily reflect the official policy or position of FXStreet nor its advertisers. The author will not be held responsible for information that is found at the end of links posted on this page.
If not otherwise explicitly mentioned in the body of the article, at the time of writing, the author has no position in any stock mentioned in this article and no business relationship with any company mentioned. The author has not received compensation for writing this article, other than from FXStreet.
FXStreet and the author do not provide personalized recommendations. The author makes no representations as to the accuracy, completeness, or suitability of this information. FXStreet and the author will not be liable for any errors, omissions or any losses, injuries or damages arising from this information and its display or use. Errors and omissions excepted.
The author and FXStreet are not registered investment advisors and nothing in this article is intended to be investment advice.
Recommended Content
Editors’ Picks

IRS says crypto staking should be taxed in response to lawsuit
The IRS stated that rewards from cryptocurrency staking are taxable upon receipt, according to a Bloomberg report on Monday, which stated the agency rejected a legal argument that sought to delay taxation until such rewards are sold or exchanged.

Solana dominates Bitcoin, Ethereum in price performance and trading volume: Glassnode
Solana is up 6% on Monday following a Glassnode report indicating that SOL has seen more capital increase than Bitcoin and Ethereum. Despite the large gains suggesting a relatively heated market, SOL could still stretch its growth before establishing a top for the cycle.

Ethereum Price Forecast: ETH risks a decline to $3,000 as investors realize increased profits and losses
Ethereum is up 4% on Monday despite increased selling pressure across long-term and short-term holders in the past two days. If whales fail to maintain their recent buy-the-dip attitude, ETH risks a decline below $3,000.

Crypto Today: BTC hits new Trump-era low as Chainlink, HBAR and AAVE lead market recovery
The global cryptocurrency market cap shrank by $500 billion after the Federal Reserve's hawkish statements on December 17. Amid the market crash, Bitcoin price declined 7.2% last week, recording its first weekly timeframe loss since Donald Trump’s re-election.

Bitcoin: 2025 outlook brightens on expectations of US pro-crypto policy
Bitcoin price has surged more than 140% in 2024, reaching the $100K milestone in early December. The rally was driven by the launch of Bitcoin Spot ETFs in January and the reduced supply following the fourth halving event in April.

Best Forex Brokers with Low Spreads
VERIFIED Low spreads are crucial for reducing trading costs. Explore top Forex brokers offering competitive spreads and high leverage. Compare options for EUR/USD, GBP/USD, USD/JPY, and Gold.