- Solana price action looked set to break out of the bearish triangle in a solid relief rally.
- SOL price action instead underwent a painful rejection that saw bulls fleeing and the risk of a drop towards $58.84.
- With geopolitics shifting back to more dire scenarios, momentum does not look great heading into the weekend for SOL investors.
Solana (SOL) price action was on the cusp of piercing a hole in the bearish triangle yesterday after a relief rally of four consecutive days took place. Instead, overnight headlines have shifted the balance from risk to risk-off. With markets on edge and nervous with the threat of the possible use of nuclear weapons by Russia and a tail risk from the meeting between Xi and Biden, investors are looking to keep their powder dry for the next week and instead enjoy the early spring sun today.
Solana price action at risk of a drop below $60.00
Solana price action is at risk of a significant drop as bears use a window of opportunity and a false sense of relief among bulls to provide a massive correction to SOL price action. This week, the relief rally hit a curb against the descending side of a bearish triangle. Bears were more than happy to use this opportunity to get in, helped by headwinds that emerged overnight from dire rhetoric on the Ukrainian situation and more negative headlines on lockdowns in China.
SOL price action is set to shed 13% as under these circumstances bulls are in no condition to turn price action back up. Expect a drop back towards $75.34 and the triangle baseline, as well as the monthly S1 support and the low of February 24 – thus making it a significant level. A break below could trigger a rapid sell off towards $58.84, which would be a 32% fall from the current level today.
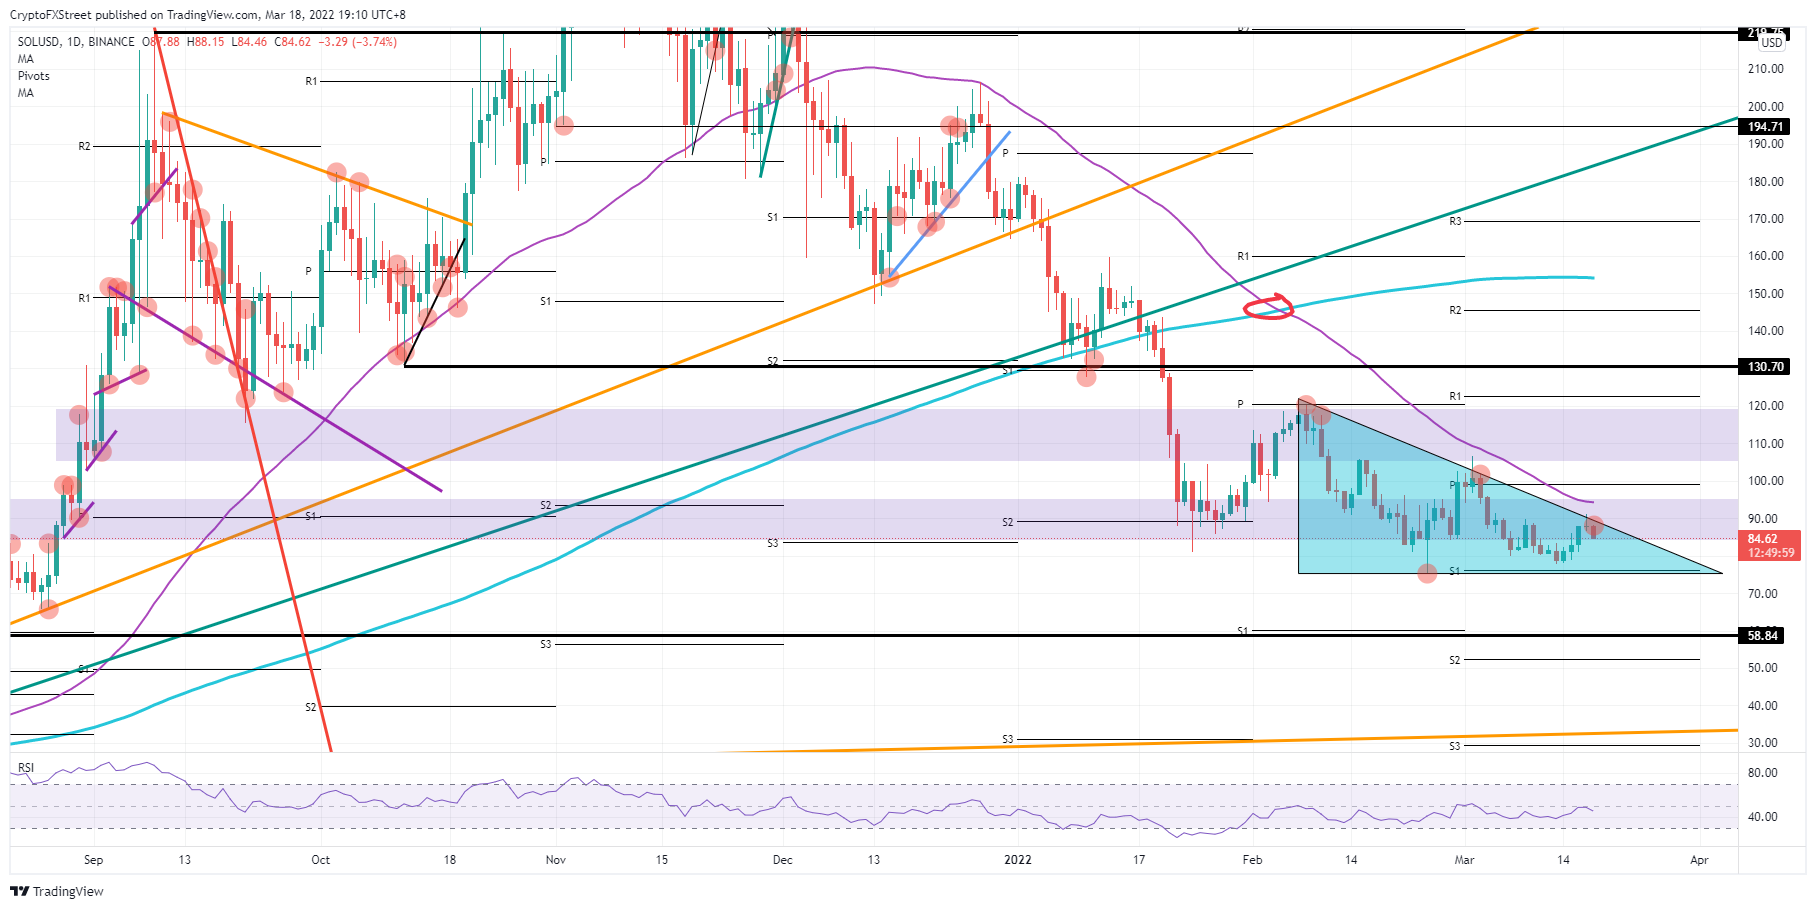
SOL/USD daily chart
Should there come a turnaround over the weekend with some progress in peace talks, expect to see a quick retest on that sloping side near $90.00. The $95.00 handle will prove to be an issue with the 55-day Simple Moving Average coming in from above. Five dollars above there, the $100 level coincides with the monthly pivot and will probably halt any further uptrend as the past two discussed levels will weigh on profit-taking and take away some of the steam in the rally.
Information on these pages contains forward-looking statements that involve risks and uncertainties. Markets and instruments profiled on this page are for informational purposes only and should not in any way come across as a recommendation to buy or sell in these assets. You should do your own thorough research before making any investment decisions. FXStreet does not in any way guarantee that this information is free from mistakes, errors, or material misstatements. It also does not guarantee that this information is of a timely nature. Investing in Open Markets involves a great deal of risk, including the loss of all or a portion of your investment, as well as emotional distress. All risks, losses and costs associated with investing, including total loss of principal, are your responsibility. The views and opinions expressed in this article are those of the authors and do not necessarily reflect the official policy or position of FXStreet nor its advertisers. The author will not be held responsible for information that is found at the end of links posted on this page.
If not otherwise explicitly mentioned in the body of the article, at the time of writing, the author has no position in any stock mentioned in this article and no business relationship with any company mentioned. The author has not received compensation for writing this article, other than from FXStreet.
FXStreet and the author do not provide personalized recommendations. The author makes no representations as to the accuracy, completeness, or suitability of this information. FXStreet and the author will not be liable for any errors, omissions or any losses, injuries or damages arising from this information and its display or use. Errors and omissions excepted.
The author and FXStreet are not registered investment advisors and nothing in this article is intended to be investment advice.
Recommended Content
Editors’ Picks

Shiba Inu eyes positive returns in April as SHIB price inches towards $0.000015
Shiba Inu's on-chain metrics reveal robust adoption, as addresses with balances surge to 1.4 million. Shiba Inu's returns stand at a solid 14.4% so far in April, poised to snap a three-month bearish trend from earlier this year.

AI tokens TAO, FET, AI16Z surge despite NVIDIA excluding crypto-related projects from its Inception program
AI tokens, including Bittensor and Artificial Superintelligence Alliance, climbed this week, with ai16z still extending gains at the time of writing on Friday. The uptick in prices of AI tokens reflects a broader bullish sentiment across the cryptocurrency market.

Bitcoin Weekly Forecast: BTC consolidates after posting over 10% weekly surge
Bitcoin price is consolidating around $94,000 at the time of writing on Friday, holding onto the recent 10% increase seen earlier this week. This week’s rally was supported by strong institutional demand, as US spot ETFs recorded a total inflow of $2.68 billion until Thursday.

XRP price could renew 25% breakout bid on surging institutional and retail adoption
Ripple price consolidates, trading at $2.18 at the time of writing on Friday, following mid-week gains to $2.30. The rejection from this weekly high led to the price of XRP dropping to the previous day’s low at $2.11, followed by a minor reversal.
Bitcoin Weekly Forecast: BTC consolidates after posting over 10% weekly surge
Bitcoin (BTC) price is consolidating around $94,000 at the time of writing on Friday, holding onto the recent 10% increase seen earlier this week.

The Best brokers to trade EUR/USD
SPONSORED Discover the top brokers for trading EUR/USD in 2025. Our list features brokers with competitive spreads, fast execution, and powerful platforms. Whether you're a beginner or an expert, find the right partner to navigate the dynamic Forex market.