- Solana price hammered lower over the past nine trading days.
- Strong buying as SOL dipped into a strong support zone.
- Bearish fake-out likely, buyers are trickling in at new three-month lows.
Solana price has not been kind to bulls of late. Over the past nine trading days, SOL has dropped nearly 30% from the high of $204.75. However, the selling pressure at the highs was nothing compared to the buying pressure at the lows – a probable signal that support has been found.
Solana price finds buyers and probable support at $144 value area, new swing high anticipated
Solana price has an impressive support zone at $144. The level at $144 contains the second-largest high volume node in the extended 2021 Volume Profile and the weekly Kijun-Sen. Additionally, the weekly Kijun-Sen has been in a flat condition for an extended period, which adds weight to its support strength.
From an oscillator perspective, the Relative Strength Index (RSI) is testing the first oversold level in a bull market (50). This is the first test of 50 for the RSI since July 16 2021. This test comes as Solana price is right on top of a significant price support level that is exceptionally positive for bulls.
The most critical oscillator condition, however, is the Composite Index. There is a hidden bullish divergence between the candlestick chart and the Composite Index. Hidden bullish divergence is when price action prints higher lows, but an oscillator prints equal or lower lows. What's more, the Composite Index hit a new all-time low. A strong bounce between $140 and $150 that will rally to the $200 value area is expected in a short period of time.
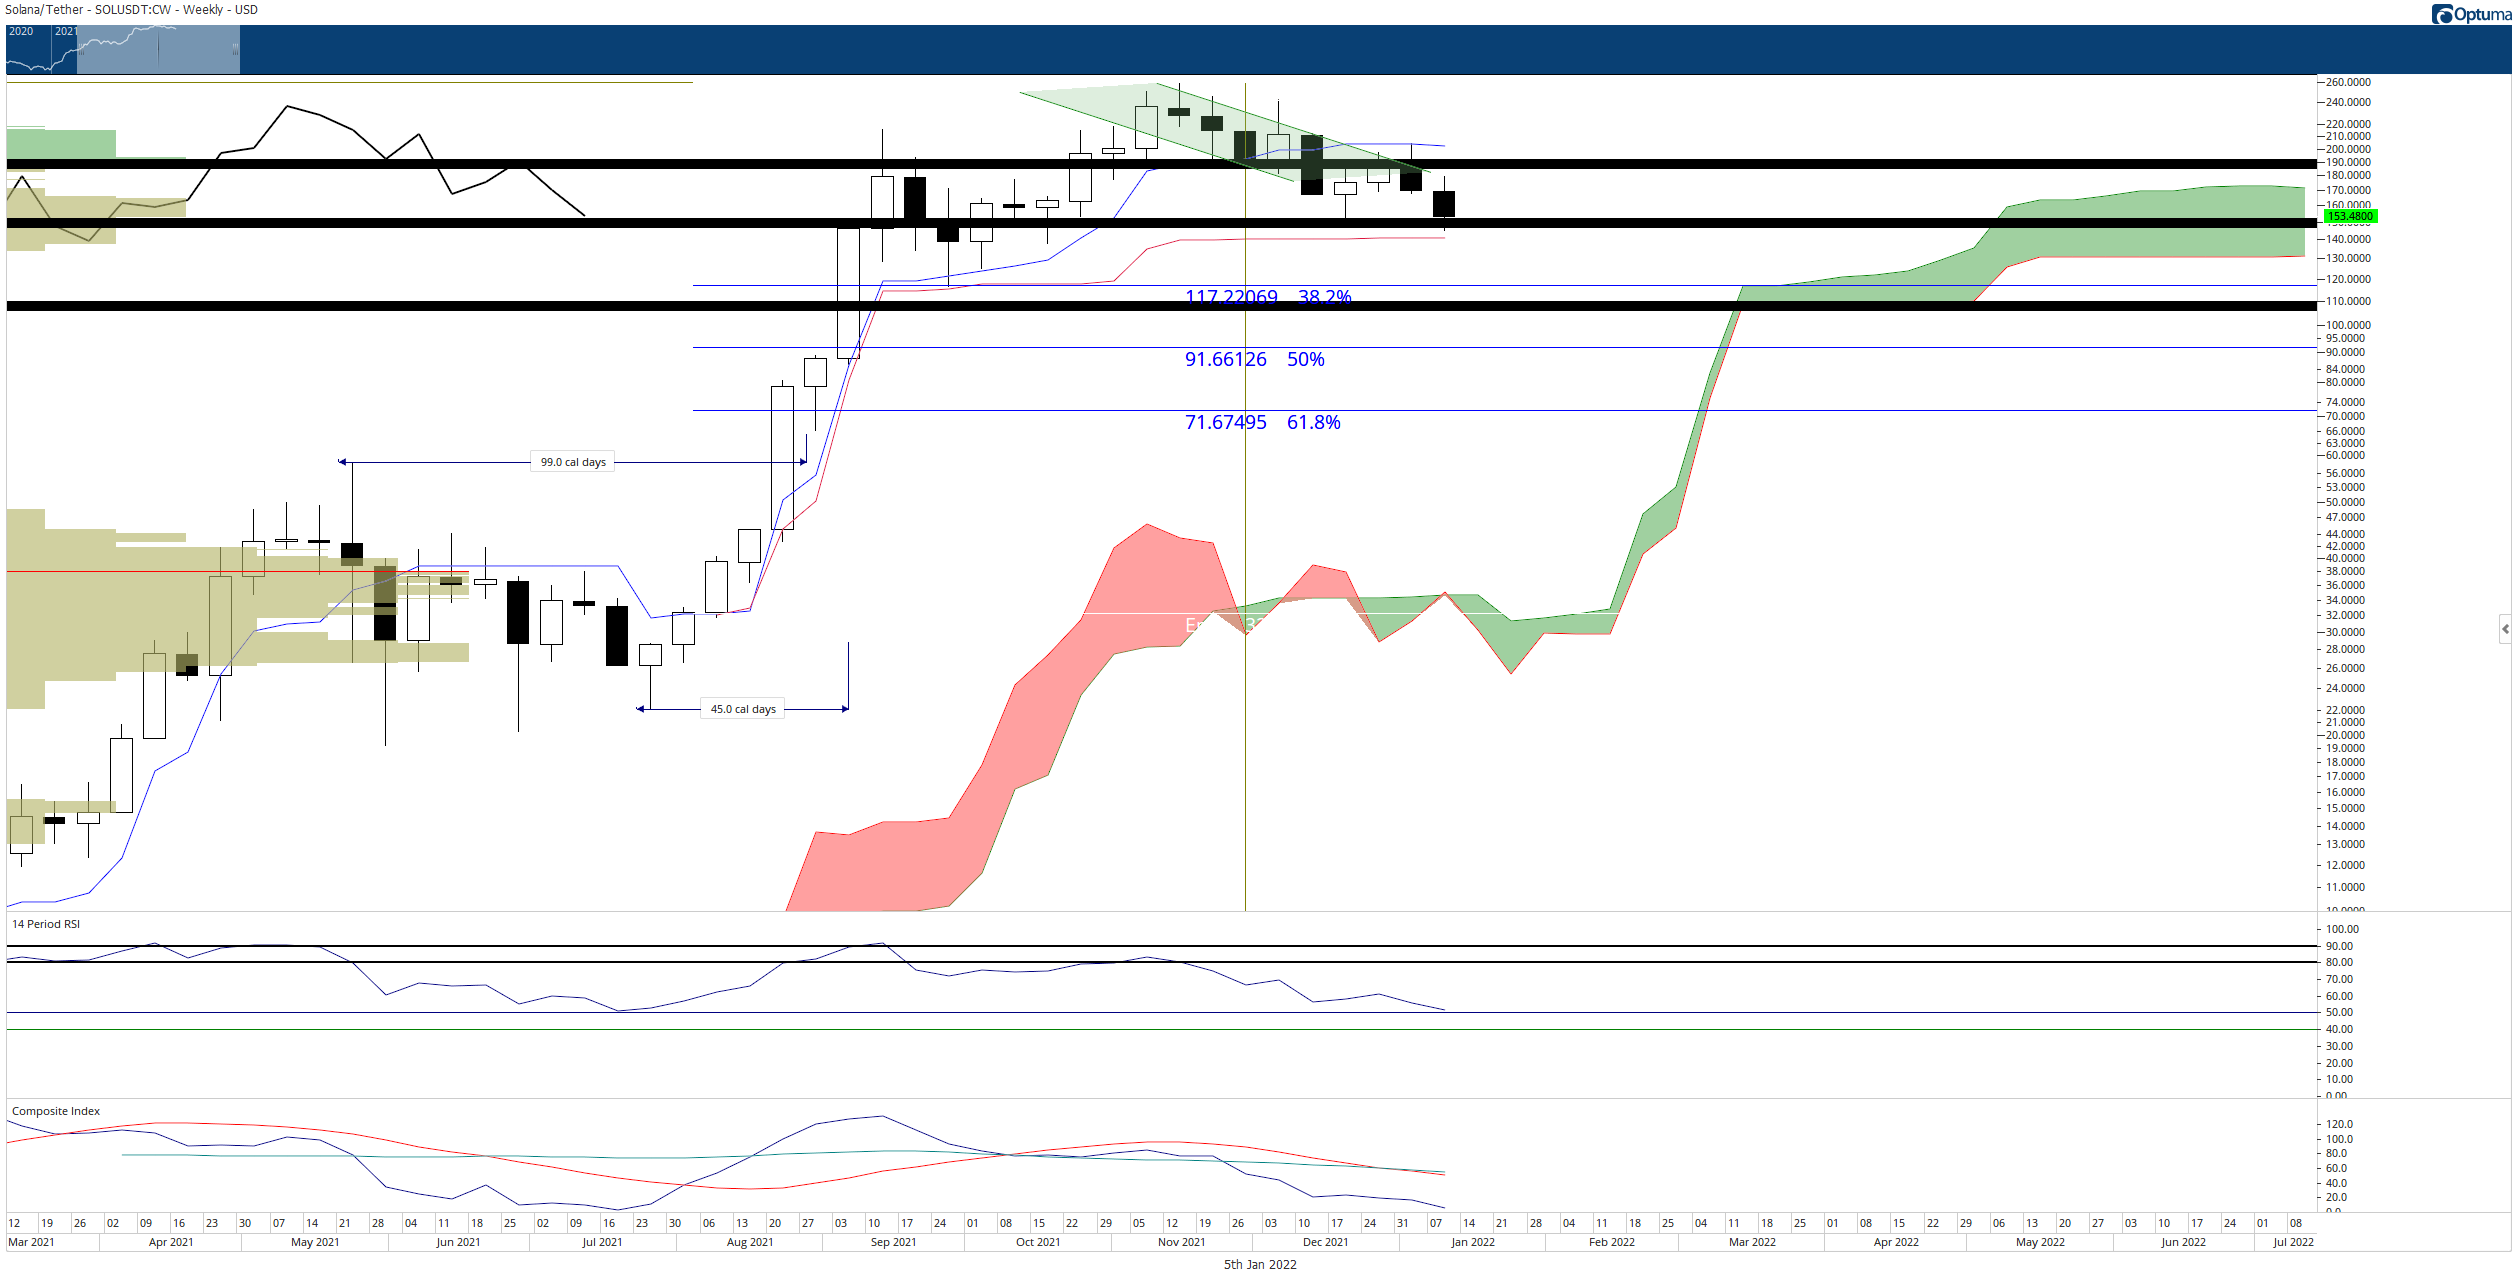
SOL/USDT Weekly Ichimoku Chart
Any near-term bullish bias will be invalidated if Solana price has a weekly or daily close below the weekly Kijun-Sen at $140.
Note: All information on this page is subject to change. The use of this website constitutes acceptance of our user agreement. Please read our privacy policy and legal disclaimer. Opinions expressed at FXstreet.com are those of the individual authors and do not necessarily represent the opinion of FXstreet.com or its management. Risk Disclosure: Trading foreign exchange on margin carries a high level of risk, and may not be suitable for all investors. The high degree of leverage can work against you as well as for you. Before deciding to invest in foreign exchange you should carefully consider your investment objectives, level of experience, and risk appetite. The possibility exists that you could sustain a loss of some or all of your initial investment and therefore you should not invest money that you cannot afford to lose. You should be aware of all the risks associated with foreign exchange trading, and seek advice from an independent financial advisor if you have any doubts.
Recommended Content
Editors’ Picks
Ripple on-chain metrics show bullish signs amidst legal struggle with SEC, XRP eyes recovery
![Ripple on-chain metrics show bullish signs amidst legal struggle with SEC, XRP eyes recovery](https://editorial.fxstreet.com/images/Markets/Currencies/Cryptocurrencies/Coins/Ripple/Ripple_Coin_31_02_XtraSmall.jpg)
Ripple made a comeback above $0.48 on Tuesday and hovers above that level in Wednesday’s European session. Ripple on-chain metrics such as transaction volume and Network Realized Profit/Loss have turned bullish, supporting a recovery in the altcoin.
Bitcoin price falls amidst German government transfers, miners activity
![Bitcoin price falls amidst German government transfers, miners activity](https://editorial.fxstreet.com/images/Markets/Currencies/Digital%20Currencies/Bitcoin/bit-coin-symbol-flag-3d-illustration-59931110_XtraSmall.jpg)
Bitcoin (BTC) extends correction on Wednesday and hovers around $61,000 after finding resistance near the $64,000 level on Monday. Recent on-chain data indicates heightened selling activity from Bitcoin miners early in the week.
Crypto Today: Bitcoin erases gains from end of June, Ethereum declines while Ripple holds
![Crypto Today: Bitcoin erases gains from end of June, Ethereum declines while Ripple holds](https://editorial.fxstreet.com/images/Markets/Currencies/Digital%20Currencies/Bitcoin/Bitcoin_2_XtraSmall.jpg)
Bitcoin wipes out gains from the last week of June and falls below $60,000 on Wednesday. Ethereum and top altcoins ranked by market capitalization erased gains as the inflation outlook worsened. Ripple holds on to recent gains and hovers above $0.48 on Wednesday.
Three reasons why altcoins could shake off losses this week
![Three reasons why altcoins could shake off losses this week](https://editorial.fxstreet.com/images/Markets/Currencies/Cryptocurrencies/cryptos_XtraSmall.jpg)
On-chain data from Santiment shows that altcoins are currently in the opportunity zone, or generating buy signals. The top three altcoins in the buy zone are Basic Attention Token (BAT), Chromia (CHR), and Highstreet (HIGH), per Santiment.
Bitcoin: BTC price correction could end in July, according to seasonal data
![Bitcoin: BTC price correction could end in July, according to seasonal data](https://editorial.fxstreet.com/images/Markets/Currencies/Digital%20Currencies/Bitcoin/bitcoin_5_XtraSmall.jpg)
Bitcoin (BTC) price appears poised for a decline this week, influenced by slight outflows in US spot ETFs, selling activity among BTC miners, and a combined transfer of 4,690.28 BTC to centralized exchanges by the US and German governments.