• Solana blockchain noted a spike in failed transactions as new tokens attract bots that spam the network. 
  • Dogwifhat, Myro, Popcat yield double-digit daily gains amidst the meme coin rally.
  • Solana price faces risk of nearly 5% correction despite rising user activity. 

The Solana blockchain has noted a surge in transaction volume and activity on its chain in response to the recent gains in meme coins. However, the meme coin frenzy has also attracted bots to the SOL network, driving the rate of failed transactions up to 72%. 

Also read: Solana-based meme coin SLERF surges more than 3,700% as developer burns $10 million presale tokens

Solana meme coin frenzy raises failed transaction concern

Meme coin rally is led by Solana-based Dogwifhat (WIF), Myro (MYRO), Bonk (BONK), Popcat (POPCAT), among others. These meme tokens have registered double-digits on the daily timeframe. 

SOL

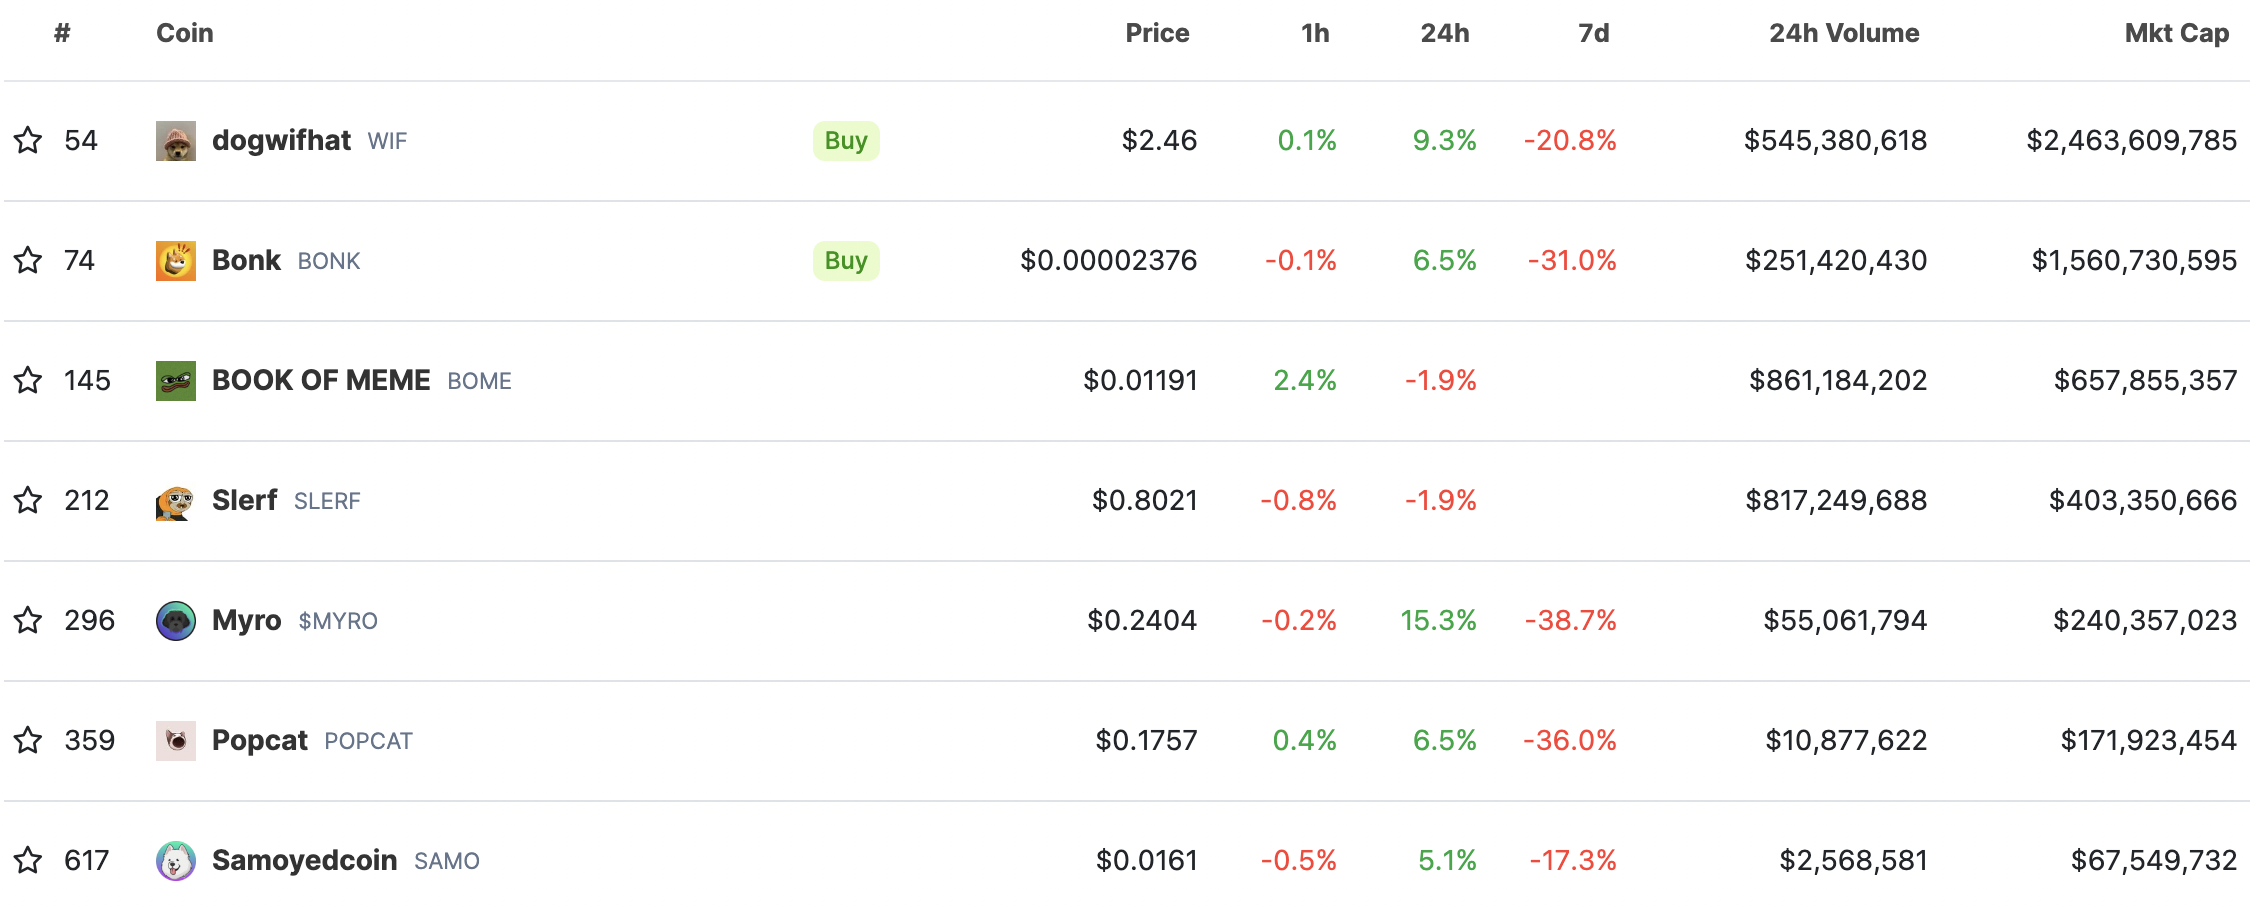
Solana-based meme coins. Source: CoinGecko 

The massive meme coin rally has prompted a rise in the DEX volume on Solana and increased transaction fees by two to three times, according to analytics by 21Shares on Dune. 

DEX

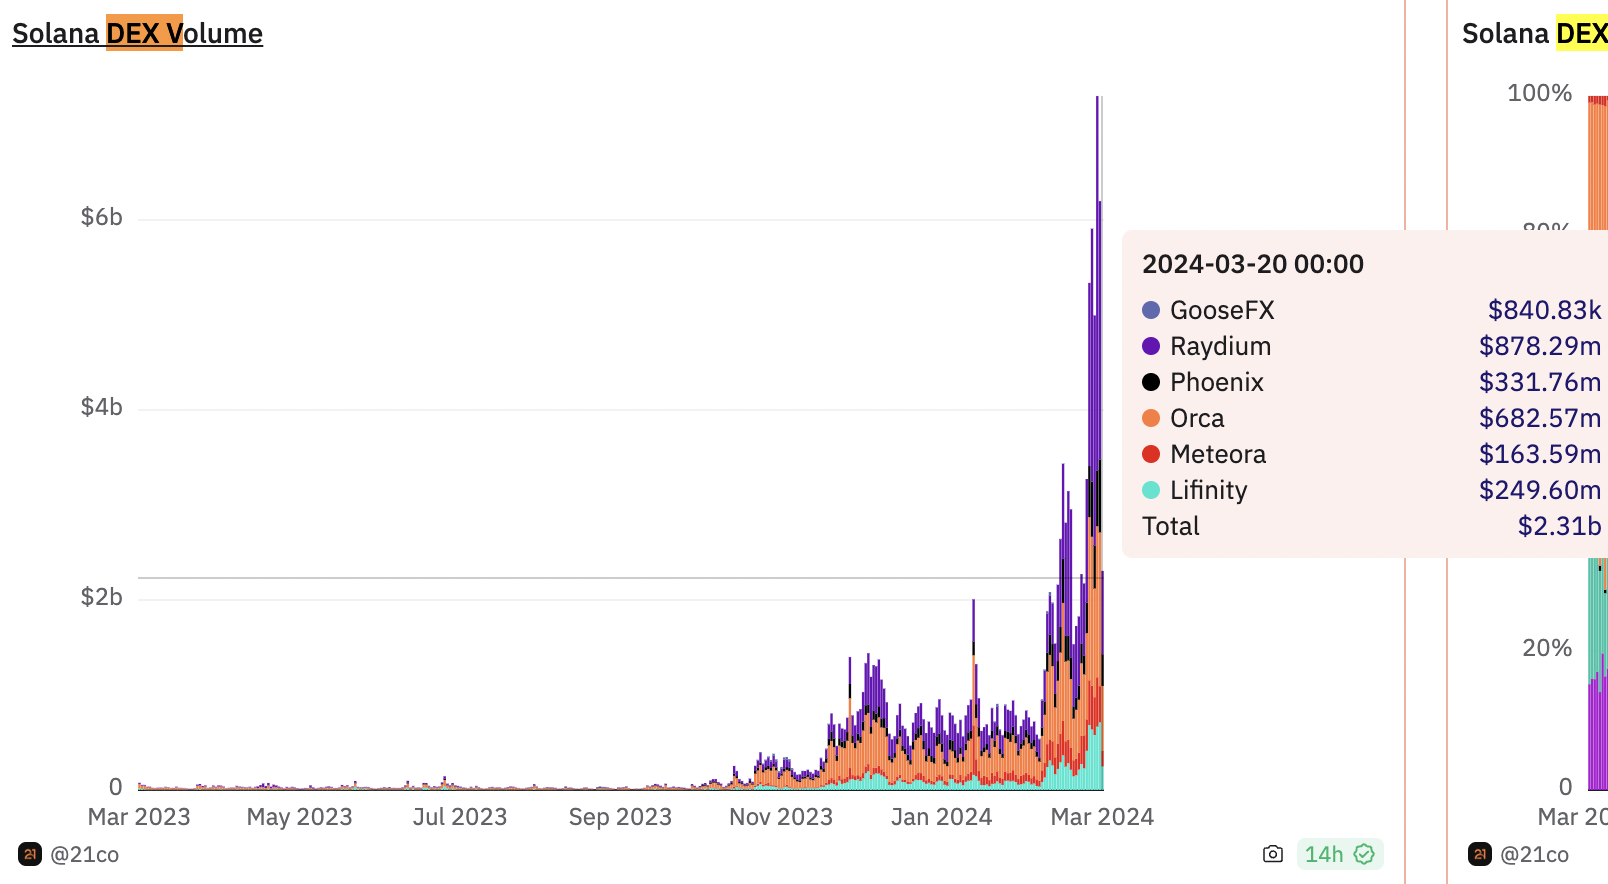
Solana DEX Volume. Source: 21Shares on Dune 

Despite the recent increase, the average transaction fee on Solana is $0.06580, cheaper than most Ethereum Layer 2 chains after the successful execution of the Dencun upgrade. 

SOL

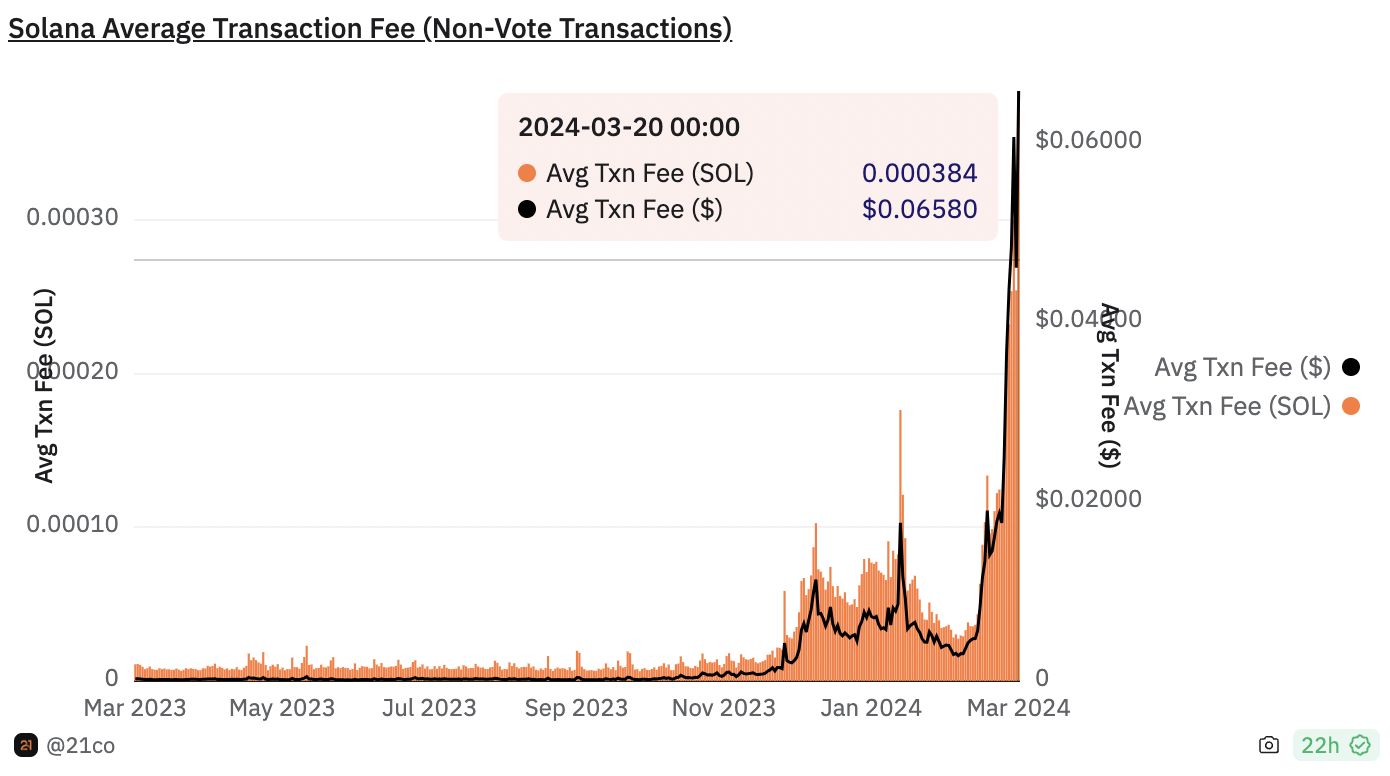
Solana Average Transaction Fee. Source: 21Shares on Dune

The rise in meme coin tokens and their transactions on the Solana blockchain has attracted bots that spam the SOL network. These bots are looking to capture potential income generation opportunities on the chain and this has caused the network to experience a large volume of failed transactions. 

According to data from Dune, 93% of the failed transactions come from bots that are spamming the network whereas organic users have a mere 17% rate of transaction failure. 

Solana price risks 5% decline

Solana price is in a short-term downward trend since the altcoin hit its year-to-date peak of $210.18 on Monday. Since then, SOL price declined nearly 12% to $189.26 at the time of writing. 

SOL price could rebound after it collects liquidity at the daily support level at $178.35. A drop to this level represents a 5% decline in SOL price. Technical indicators suggest that the altcoin is likely to reattempt a rally to the year-to-date peak of $210.18. 

The Moving Average Convergence/Divergence indicator is flashing green bars above the zero line, signaling positive momentum in SOL. The Relative Strength Index (RSI) reads 66.65, out of the overbought zone above 70, signaling there is further room for gains.

SOL could face resistance at $186.28, the 78.6% Fibonacci retracement level, on its way to its target of $210.18. 

SOL/USDT

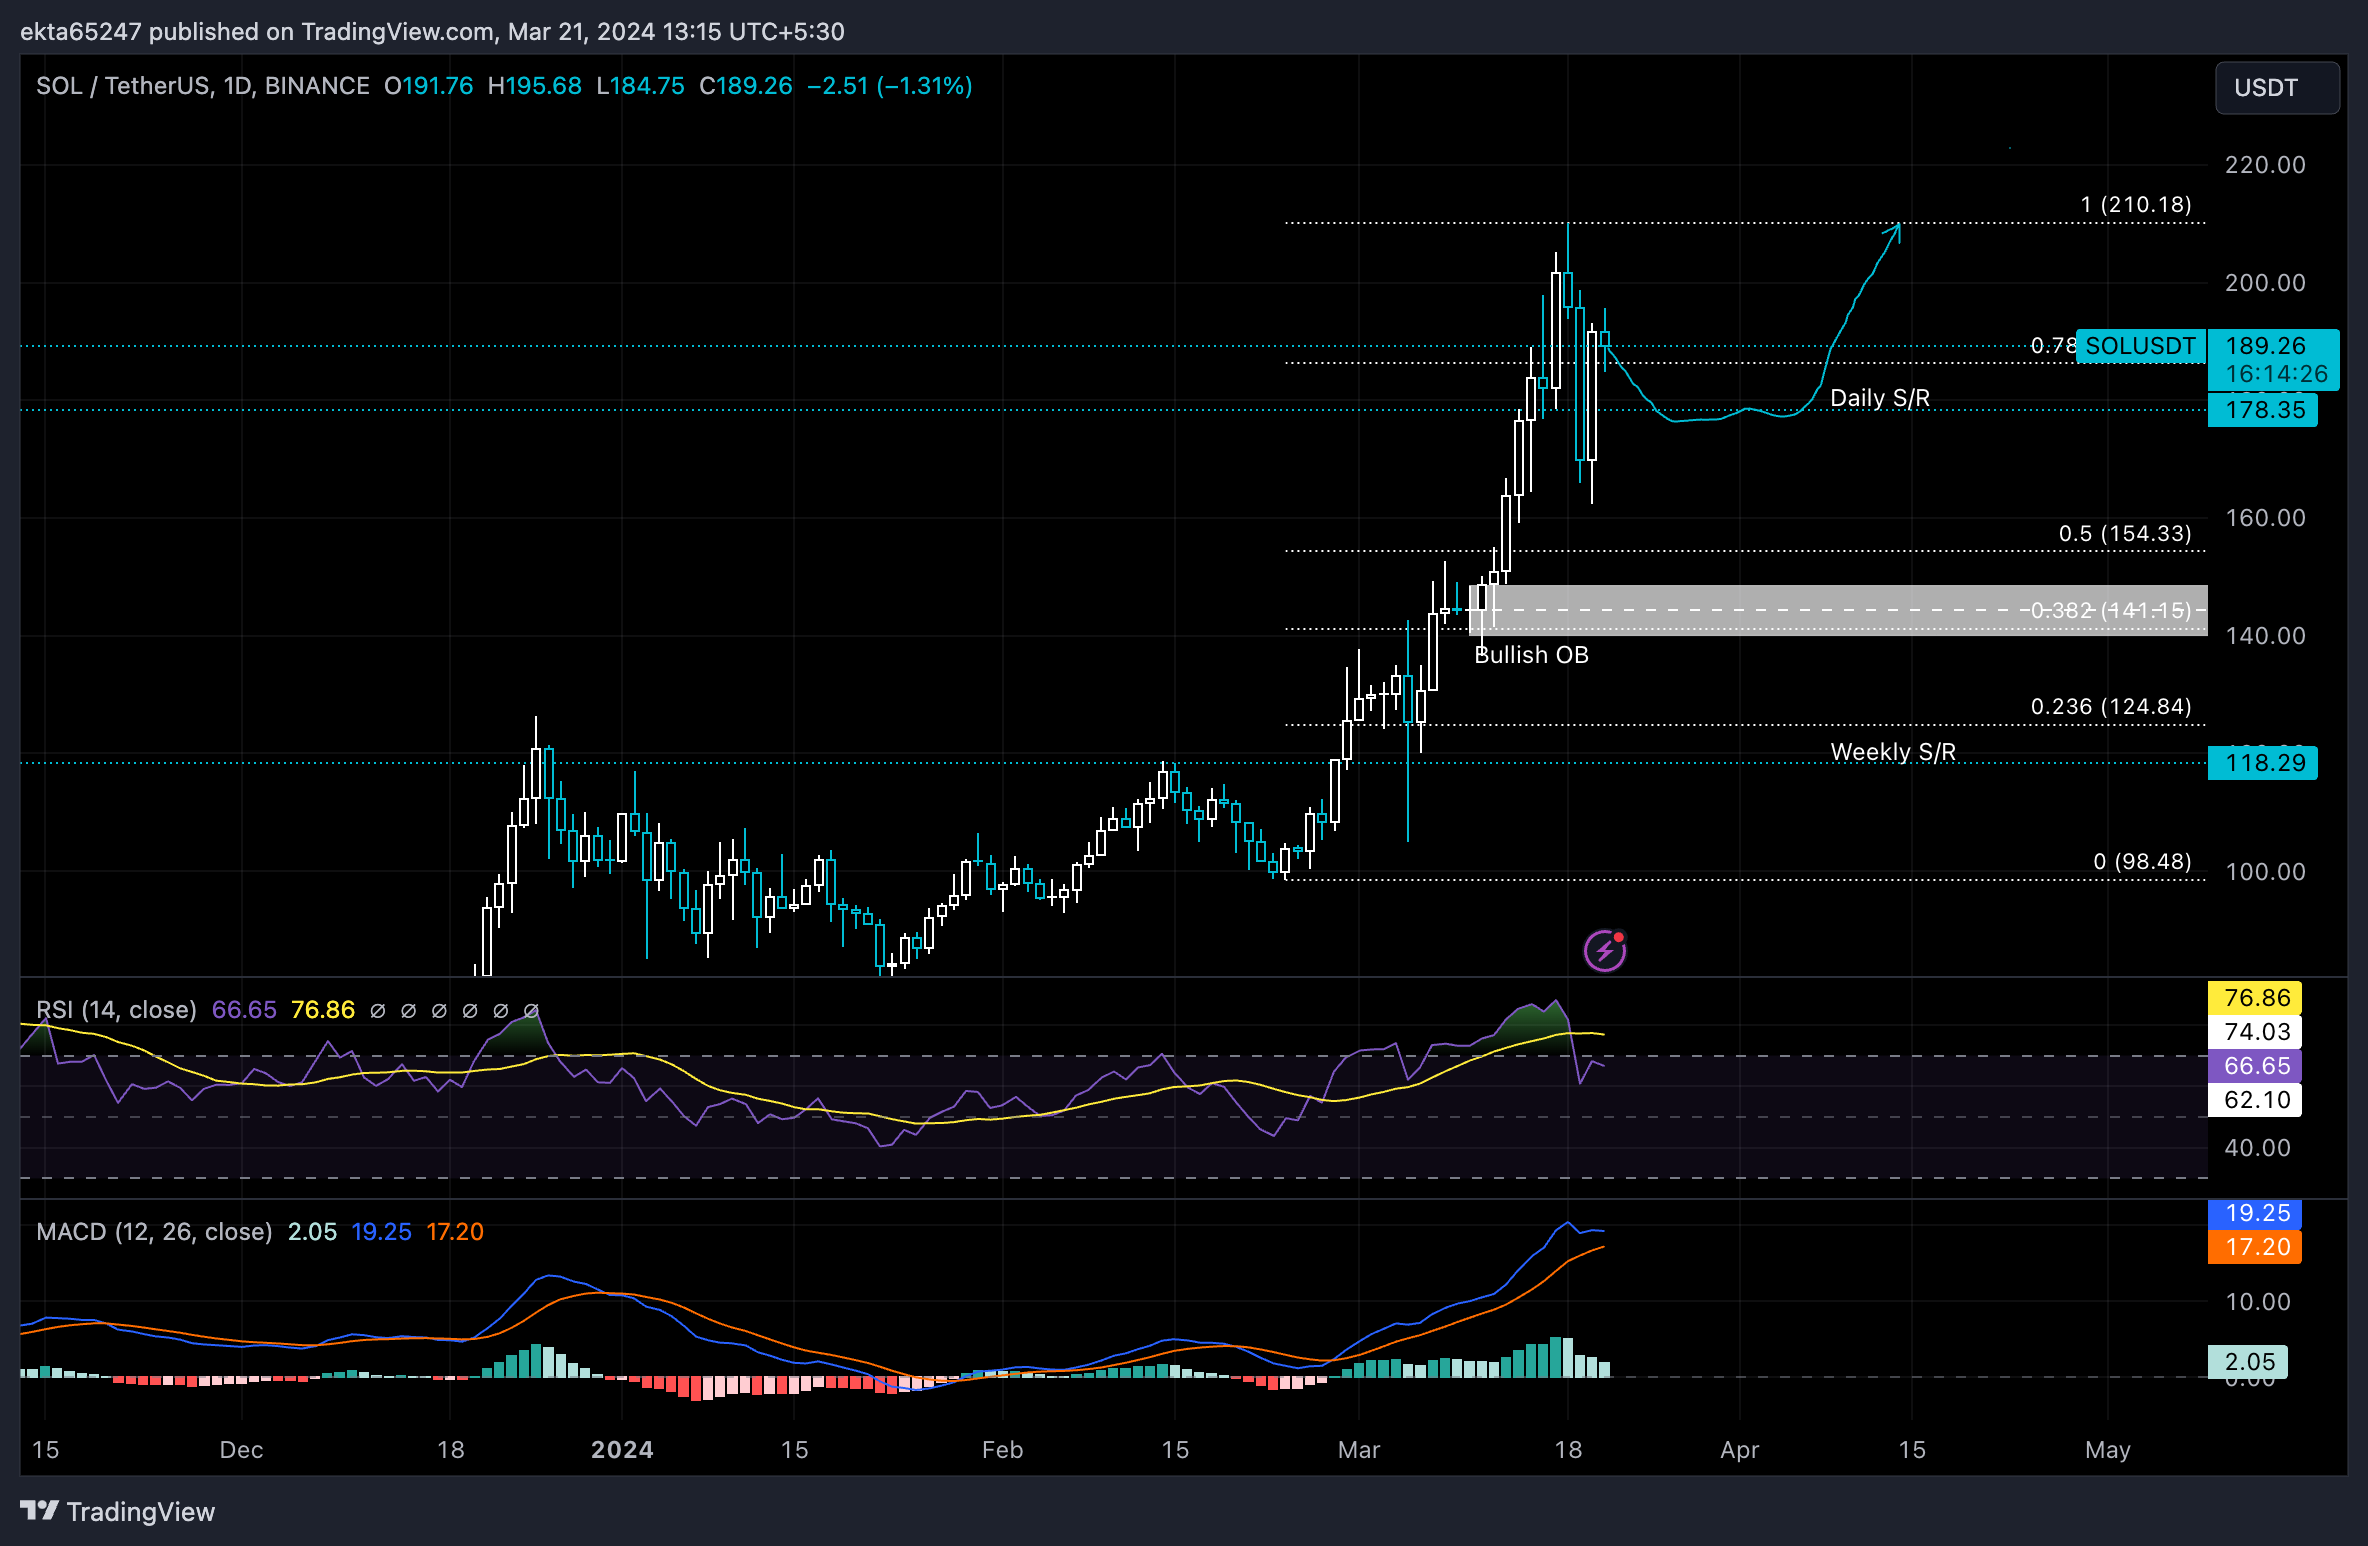
SOL/USDT 1-day chart 

If SOL closes the day below $178.35, the daily support, it could invalidate the thesis of a rebound. In such a case, Solana price could fall to the bullish order block between $140 and $148 to collect liquidity. 

SOL price could find support at $141.15 and $124.84, the 38.2% and 23.6% Fibonacci retracement levels, respectively, on the daily chart. Further down, $118.29, the weekly support level, is an important support for SOL. 


Information on these pages contains forward-looking statements that involve risks and uncertainties. Markets and instruments profiled on this page are for informational purposes only and should not in any way come across as a recommendation to buy or sell in these assets. You should do your own thorough research before making any investment decisions. FXStreet does not in any way guarantee that this information is free from mistakes, errors, or material misstatements. It also does not guarantee that this information is of a timely nature. Investing in Open Markets involves a great deal of risk, including the loss of all or a portion of your investment, as well as emotional distress. All risks, losses and costs associated with investing, including total loss of principal, are your responsibility. The views and opinions expressed in this article are those of the authors and do not necessarily reflect the official policy or position of FXStreet nor its advertisers. The author will not be held responsible for information that is found at the end of links posted on this page.

If not otherwise explicitly mentioned in the body of the article, at the time of writing, the author has no position in any stock mentioned in this article and no business relationship with any company mentioned. The author has not received compensation for writing this article, other than from FXStreet.

FXStreet and the author do not provide personalized recommendations. The author makes no representations as to the accuracy, completeness, or suitability of this information. FXStreet and the author will not be liable for any errors, omissions or any losses, injuries or damages arising from this information and its display or use. Errors and omissions excepted.

The author and FXStreet are not registered investment advisors and nothing in this article is intended to be investment advice.

Join Telegram

Recommended content


Recommended Content

Editors’ Picks

Ripple on-chain metrics show bullish signs amidst legal struggle with SEC, XRP eyes recovery

Ripple on-chain metrics show bullish signs amidst legal struggle with SEC, XRP eyes recovery

Ripple made a comeback above $0.48 on Tuesday and hovers above that level in Wednesday’s European session. Ripple on-chain metrics such as transaction volume and Network Realized Profit/Loss have turned bullish, supporting a recovery in the altcoin. 

More Ripple News

Bitcoin price falls amidst German government transfers, miners activity

Bitcoin price falls amidst German government transfers, miners activity

Bitcoin (BTC) extends correction on Wednesday and hovers around $61,000 after finding resistance near the $64,000 level on Monday. Recent on-chain data indicates heightened selling activity from Bitcoin miners early in the week. 

More Bitcoin News

Crypto Today: Bitcoin erases gains from end of June, Ethereum declines while Ripple holds

Crypto Today: Bitcoin erases gains from end of June, Ethereum declines while Ripple holds

Bitcoin wipes out gains from the last week of June and falls below $60,000 on Wednesday. Ethereum and top altcoins ranked by market capitalization erased gains as the inflation outlook worsened. Ripple holds on to recent gains and hovers above $0.48 on Wednesday. 

More Cryptocurrencies News

Three reasons why altcoins could shake off losses this week

Three reasons why altcoins could shake off losses this week

On-chain data from Santiment shows that altcoins are currently in the opportunity zone, or generating buy signals. The top three altcoins in the buy zone are Basic Attention Token (BAT), Chromia (CHR), and Highstreet (HIGH), per Santiment. 

More Altcoins News

Bitcoin: BTC price correction could end in July, according to seasonal data

Bitcoin: BTC price correction could end in July, according to seasonal data

Bitcoin (BTC) price appears poised for a decline this week, influenced by slight outflows in US spot ETFs, selling activity among BTC miners, and a combined transfer of 4,690.28 BTC to centralized exchanges by the US and German governments.

Read full analysis

BTC

ETH

XRP