- Solana bears are dictating price action with a few technical indicators in their corner.
- However, the devil is in the detail with positive divergence in the RSI.
- This could point to a bullish breakout to come as soon as next week, with prices trading back above $146.
Solana (SOL) price action has been delivered to the mercy of bears for the moment, but those same bears could be facing a surprise to come as early as next week. Although bears are squeezing bulls against the $90-handle and investors have already stepped in multiple times these past few weeks to save SOL price action from falling, the Relative Strength Index (RSI) is flatlining to slowly grind back higher, pointing to a bullish breakout. Expect as soon as next week to see the price shoot back up first to $120, breaking the high from last week and next target $146 to the upside, holding 55% gains.
Solana bulls are setting the stage for 55% gains over the coming week or two
Solana price action got a bit delivered to the mercy of bears since the downturn in January. The firm rejection against the monthly pivot at $120 last week only added more short positions against SOL price action. But the devil is in the detail as usual, and the RSI would already long be trading in the oversold area.
As SOL bulls have been buying and defending $90-handle, the RSI is even slowly grinding up, showing positive divergence and could point to a possible bullish breakout. As bulls hoard any SOL coins available at these levels, bears will be unable to start booking profit and buying at higher prices. This will spiral into a buying frenzy and quickly ramp up the price towards $120 against the monthly pivot.
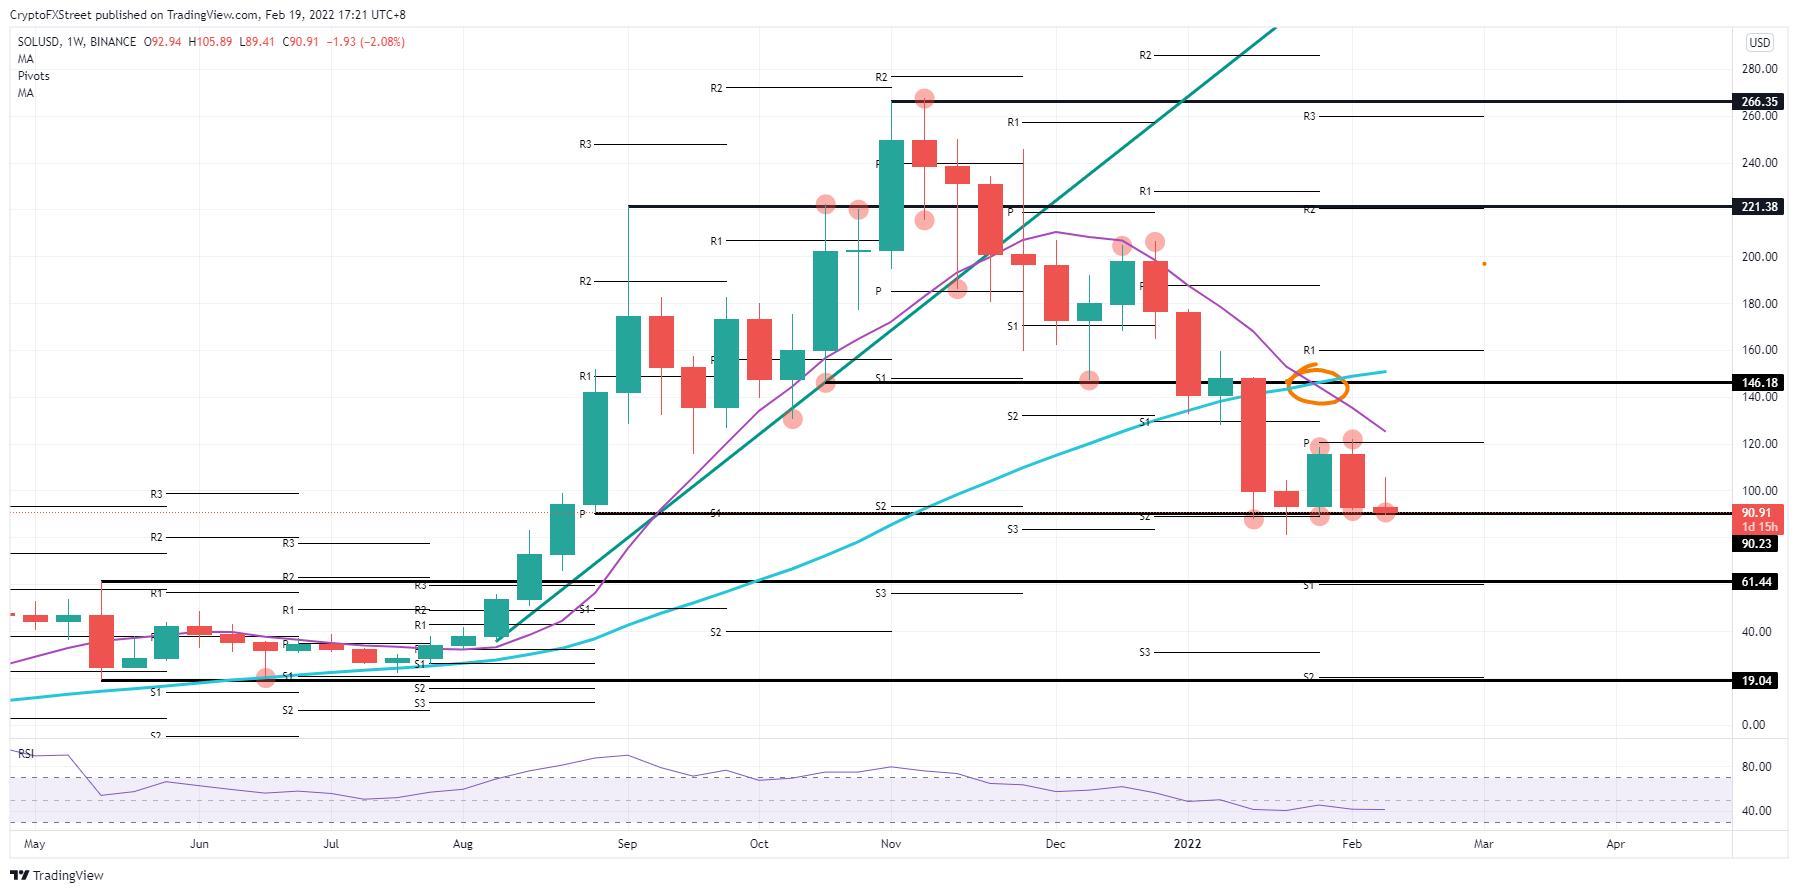
SOL/USD weekly chart
As the ultimate target will be $146, once bulls have taken out the high from last week, the 55-day Simple Moving Average (SMA) has not yet proven its strength as being the bearish camp at the moment. With the death cross formation, the 55-day becomes a price-action cap. So that one could cut short the profit target for bulls at $146 and rather see another rejection around $120, turning price action back down to $90 for bulls to pick it up again as the squeeze to the downside continues.
Information on these pages contains forward-looking statements that involve risks and uncertainties. Markets and instruments profiled on this page are for informational purposes only and should not in any way come across as a recommendation to buy or sell in these assets. You should do your own thorough research before making any investment decisions. FXStreet does not in any way guarantee that this information is free from mistakes, errors, or material misstatements. It also does not guarantee that this information is of a timely nature. Investing in Open Markets involves a great deal of risk, including the loss of all or a portion of your investment, as well as emotional distress. All risks, losses and costs associated with investing, including total loss of principal, are your responsibility. The views and opinions expressed in this article are those of the authors and do not necessarily reflect the official policy or position of FXStreet nor its advertisers. The author will not be held responsible for information that is found at the end of links posted on this page.
If not otherwise explicitly mentioned in the body of the article, at the time of writing, the author has no position in any stock mentioned in this article and no business relationship with any company mentioned. The author has not received compensation for writing this article, other than from FXStreet.
FXStreet and the author do not provide personalized recommendations. The author makes no representations as to the accuracy, completeness, or suitability of this information. FXStreet and the author will not be liable for any errors, omissions or any losses, injuries or damages arising from this information and its display or use. Errors and omissions excepted.
The author and FXStreet are not registered investment advisors and nothing in this article is intended to be investment advice.
Recommended Content
Editors’ Picks

Litecoin Price Prediction: LTC tries to retake $100 resistance as miners halt sell-off
Litecoin price grazed 105 mark on Monday, rebounding 22% from the one-month low of $87 recorded during last week’s market crash. On-chain data shows sell pressure among LTC miners has subsided. Is the bottom in?

Bitcoin fails to recover as Metaplanet buys the dip
Bitcoin price struggles around $95,000 after erasing gains from Friday’s relief rally over the weekend. Bitcoin’s weekly price chart posts the first major decline since President-elect Donald Trump’s win in November.

SEC Commissioner Hester Pierce sheds light on Ethereum ETF staking under new administration
In a Friday interview with Coinage, SEC Commissioner Hester Peirce discussed her optimism about upcoming regulatory changes as the agency transitions to new leadership under President Trump’s pick for new Chair, Paul Atkins.

Bitcoin dives 3% from its recent all-time high, is this the cycle top?
Bitcoin investors panicked after the Fed's hawkish rate cut decision, hitting the market with high selling pressure. Bitcoin's four-year market cycle pattern indicates that the recent correction could be temporary.
Bitcoin: 2025 outlook brightens on expectations of US pro-crypto policy
Bitcoin price has surged more than 140% in 2024, reaching the $100K milestone in early December. The rally was driven by the launch of Bitcoin Spot ETFs in January and the reduced supply following the fourth halving event in April.

Best Forex Brokers with Low Spreads
VERIFIED Low spreads are crucial for reducing trading costs. Explore top Forex brokers offering competitive spreads and high leverage. Compare options for EUR/USD, GBP/USD, USD/JPY, and Gold.