SOL wants to fight but broader market bearishness won’t allow Solana price to go solely


  • Solana price is bullish, up 25% from the September 10 low of $17.33 with a commitment to more upside potential.
  • SOL could rise 10% to breach the 100-day EMA resistance at $24.40 if bullish momentum grows.
  • With Bitcoin, Ethereum, and Ripple still struggling, it may be premature for the purported ETH killer to go up solely.
  • Invalidation of the bullish outlook will occur upon a three-day candlestick close below the $critical support at $17.80.

Solana (SOL) price is trading with a bullish bias, with CoinMarketCap data showing that it is outperforming Bitcoin (BTC), Ethereum (ETH), and Ripple (XRP), the crypto top three. However, the upside for the purported ETH killer is pending, with a broader market struggle making it hard for SOL to go solely.

Also Read: Solana inflows dominate altcoin space as funding rout plagues sector

Solana price held back by broader market bearishness

Solana (SOL) price is trading with a bullish bias, recording a surge of almost 5% in the last 24 hours. After a week-long consolidation earlier in the month, the volatility for the altcoin was restored ahead of the Sam Bankman-Fried (SBF) trial, which saw up to $455 million worth of SOL with investors observing the token.

Meanwhile, technical indicators suggest that Solana price is ready to fight for its upside potential, with the Relative Strength Index (RSI) deviating north while holding above the 50 midline. The lagging Awesome Oscillator (AO) is equally positive, green-toned and holding above the zero level.

Increased buying pressure above current levels, steered by buying momentum from the $21.27 buyer congestion level marked by the 50-day Exponential Moving Average (EMA) could see Solana price breach the immediate barricade at $24.40. This roadblock is presented by the 100-day EMA.

If Solana price flips the 100-day EMA into a support floor, the ensuing buying pressure could send SOL to confront the stiff resistance at $26.96 hurdle. In a highly bullish case, the gains could extend to tag the 200-day EMA at $31.24. Such a move would constitute a 40% climb above current levels.

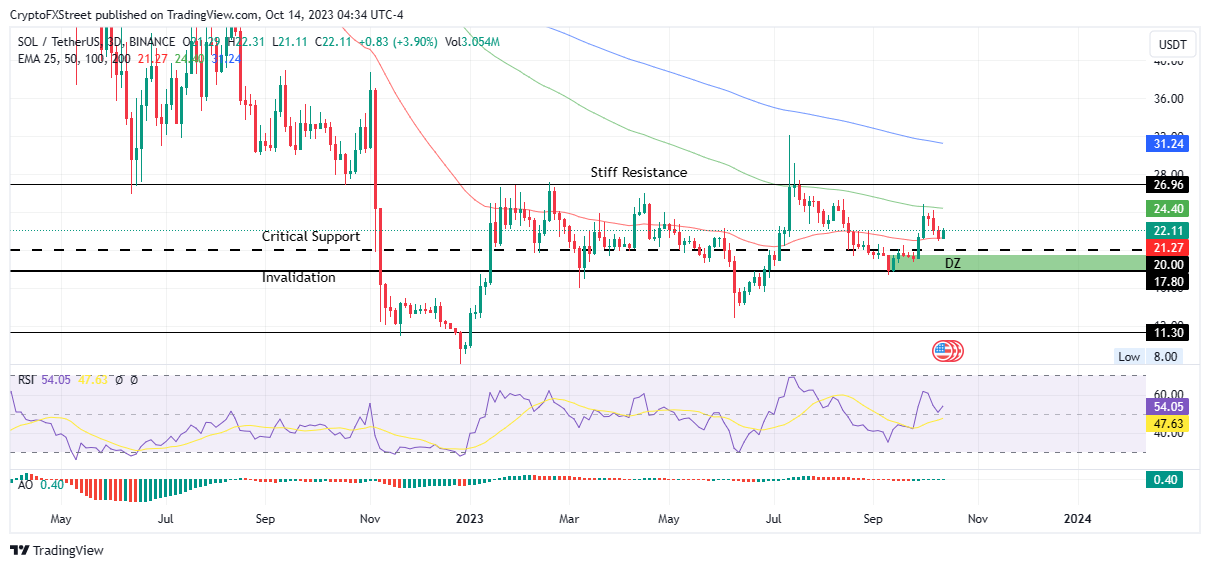
SOL/USDT 3-day chart

Conversely, with early profit taking possibly from the traders that bought SOL during the most recent dip, Solana price could pull south to lose the support offered by the 50-day EMA at $21.27. A move below the critical support of $20.00 would flip the balance in favor of the bears but the bullish outlook would only be invalidated once SOL breaks below the $17.80 support. This marks the last lower high.

The ensuing proceeding selling pressure could send Solana price below the $16.00 psychological level. This would denote a 30% drop below current levels. 


Information on these pages contains forward-looking statements that involve risks and uncertainties. Markets and instruments profiled on this page are for informational purposes only and should not in any way come across as a recommendation to buy or sell in these assets. You should do your own thorough research before making any investment decisions. FXStreet does not in any way guarantee that this information is free from mistakes, errors, or material misstatements. It also does not guarantee that this information is of a timely nature. Investing in Open Markets involves a great deal of risk, including the loss of all or a portion of your investment, as well as emotional distress. All risks, losses and costs associated with investing, including total loss of principal, are your responsibility. The views and opinions expressed in this article are those of the authors and do not necessarily reflect the official policy or position of FXStreet nor its advertisers. The author will not be held responsible for information that is found at the end of links posted on this page.

If not otherwise explicitly mentioned in the body of the article, at the time of writing, the author has no position in any stock mentioned in this article and no business relationship with any company mentioned. The author has not received compensation for writing this article, other than from FXStreet.

FXStreet and the author do not provide personalized recommendations. The author makes no representations as to the accuracy, completeness, or suitability of this information. FXStreet and the author will not be liable for any errors, omissions or any losses, injuries or damages arising from this information and its display or use. Errors and omissions excepted.

The author and FXStreet are not registered investment advisors and nothing in this article is intended to be investment advice.

Join Telegram

Recommended content


Recommended Content

Editors’ Picks

Celebrity meme coins controversy continues amid Pump.fun revenue dominance

Celebrity meme coins controversy continues amid Pump.fun revenue dominance

Pump.fun outperformed the Ethereum blockchain on Tuesday after raking in $1.99 million. Following this achievement, a meme coin based on actress Sydney Sweeney was the subject of controversy after its developers dumped their bags on investors.

More Meme Coins News

PEPE's on-chain metrics indicate potential rally after weeks of silence

PEPE's on-chain metrics indicate potential rally after weeks of silence

PEPE has struggled to see any significant price move after reaching an all-time high in May. Increased adoption rate and low MVRV ratio indicate a bullish run may be on the horizon. A single PEPE outflow from Binance worth $14.7 million gives credence to signs of bullish expectation.

More Pepe News

Ethereum has failed to overcome key resistance despite bullish sentiment surrounding ETH ETF

Ethereum has failed to overcome key resistance despite bullish sentiment surrounding ETH ETF

Ethereum (ETH) is down more than 1.4% on Tuesday following another ETH sale from the Ethereum Foundation. Meanwhile, crypto exchange Gemini's recent report reveals that ETH ETF could see about $5 billion in net inflows within six months of launch.

More Ethereum News

Crypto community blasts Polkadot following report of treasury spending

Crypto community blasts Polkadot following report of treasury spending

Polkadot reports $87 million of treasury spending during H1. Crypto community members expressed harsh feelings toward the DOT team's high spending. DOT is up more than 2% in the past 24 hours but risks correction following the report.

More Polkadot News

Bitcoin: BTC price correction could end in July, according to seasonal data

Bitcoin: BTC price correction could end in July, according to seasonal data

Bitcoin (BTC) price appears poised for a decline this week, influenced by slight outflows in US spot ETFs, selling activity among BTC miners, and a combined transfer of 4,690.28 BTC to centralized exchanges by the US and German governments.

Read full analysis

BTC

ETH

XRP