- Shiba Inu price is hovering above the $0.0000223 support level, eyeing a 40% upswing.
- A quick liquidity run below $0.0000202 is likely before triggering the move to $0.0000283.
- A daily candlestick close below $0.0000158 will invalidate the bullish thesis for SHIB.
Shiba Inu price action seems to be repeating itself after a recent breakout from its downtrend. The rebound is pausing and might go for a liquidity run below a vital support level before a full-blown rally kicks off.
Shiba Inu price prepares for a new leg-up
Shiba Inu price crashed 77% from its all-time high before setting up a swing low around $0.0000202. The downswing, however, was breached on February 3, as price undertook a u-turn and made a 75% ascent. The new uptrend failed to sustain, however, leading to another downswing.
After a brief period of consolidation, SHIB breached through its mini downtrend and is currently establishing a support level around $0.0000223 before triggering an explosive rally higher. However, investors can expect Shiba Inu price to slide lower first in search of liquidity below the $0.0000202 barrier.
Such a move will signal the start of an uptrend and interested investors can enter long at $0.0000202. The resulting momentum will likely catapult SHIB to retest the immediate hurdle at $0.0000283.
This move would constitute a 40% gain and is where market participants can book profits.
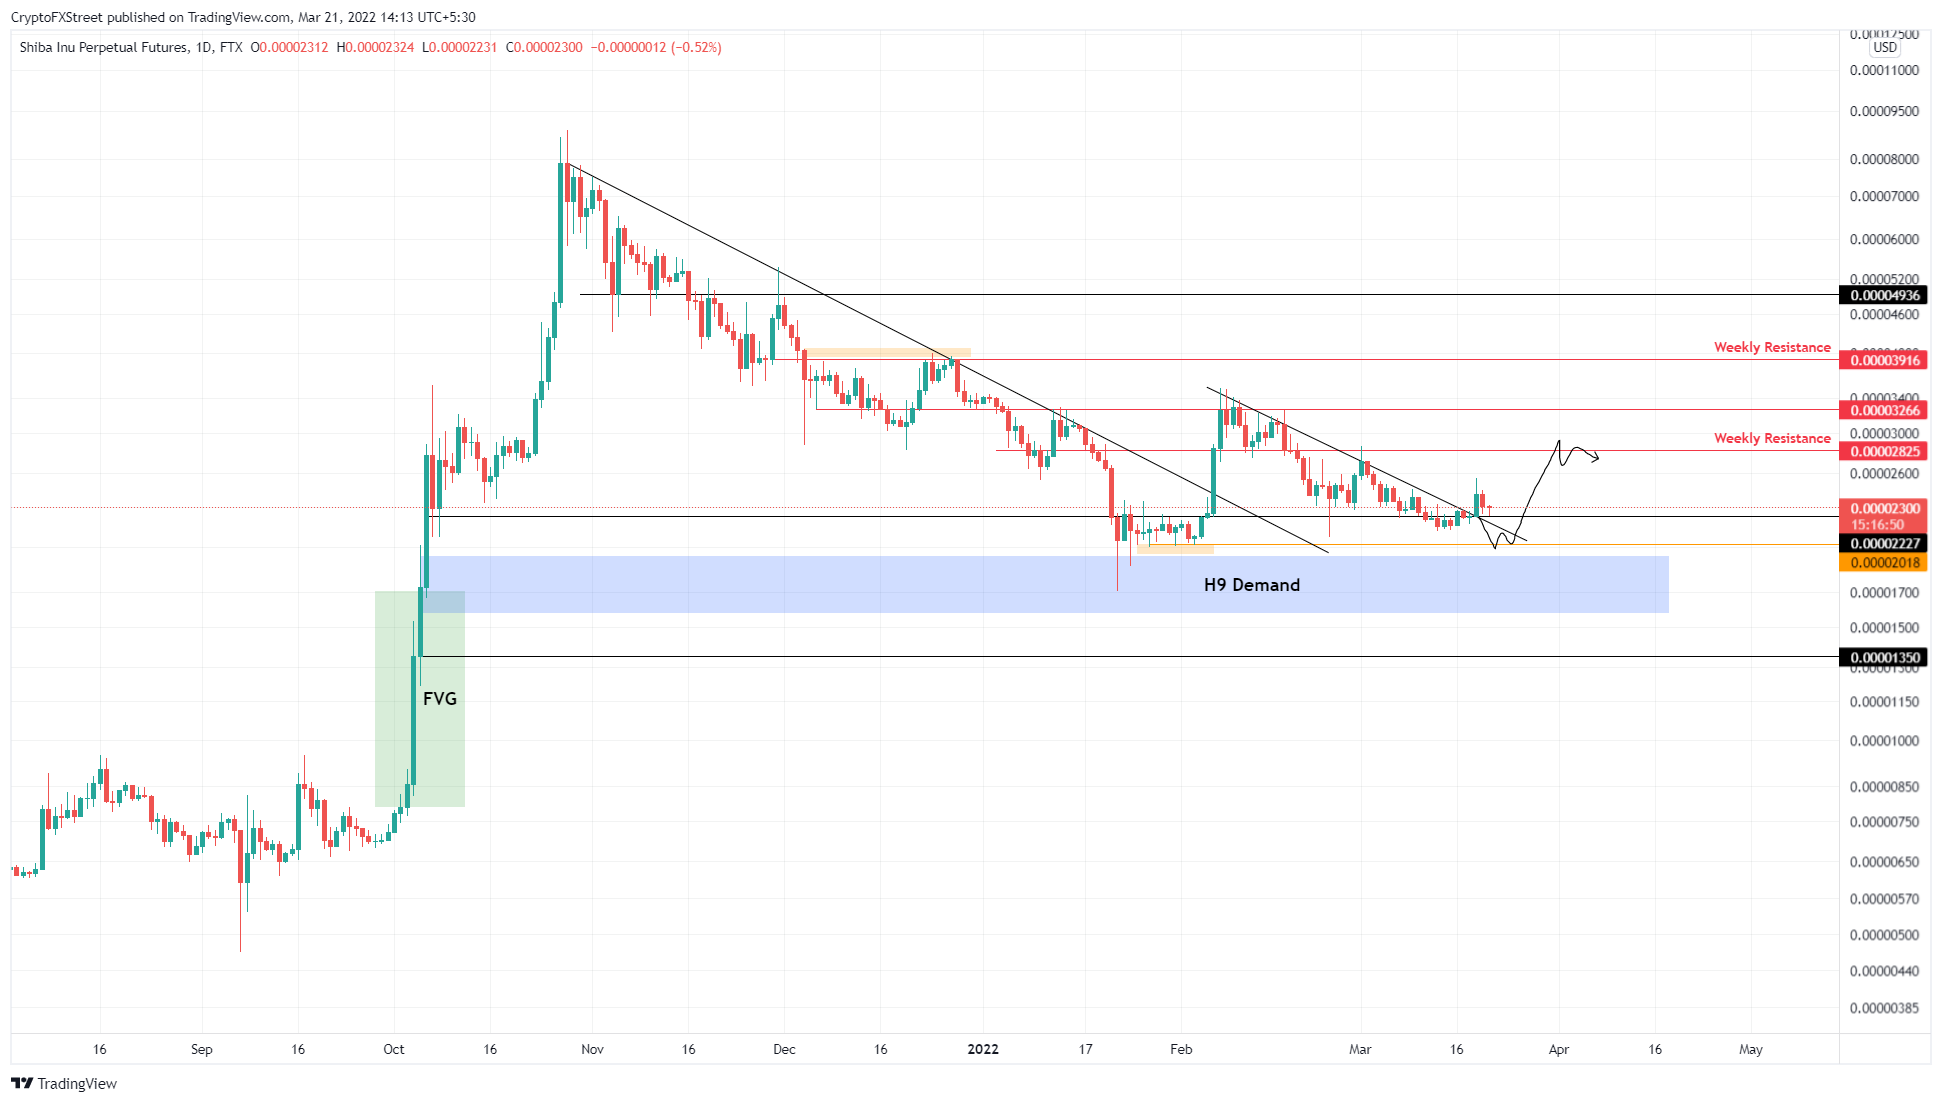
SHIB/USDT 1-day chart
Even if Shiba Inu price breaches the $0.0000202 barrier, the bulls will have another chance to regroup and attempt a run-up into the nine-hour demand zone, ranging from $0.0000158 to $0.0000193.
A daily candlestick close below $0.0000193, however, will produce a lower low and invalidate the bullish thesis. In this scenario, Shiba Inu price could crash 15% and retest the $0.0000135 support level.
Information on these pages contains forward-looking statements that involve risks and uncertainties. Markets and instruments profiled on this page are for informational purposes only and should not in any way come across as a recommendation to buy or sell in these assets. You should do your own thorough research before making any investment decisions. FXStreet does not in any way guarantee that this information is free from mistakes, errors, or material misstatements. It also does not guarantee that this information is of a timely nature. Investing in Open Markets involves a great deal of risk, including the loss of all or a portion of your investment, as well as emotional distress. All risks, losses and costs associated with investing, including total loss of principal, are your responsibility. The views and opinions expressed in this article are those of the authors and do not necessarily reflect the official policy or position of FXStreet nor its advertisers. The author will not be held responsible for information that is found at the end of links posted on this page.
If not otherwise explicitly mentioned in the body of the article, at the time of writing, the author has no position in any stock mentioned in this article and no business relationship with any company mentioned. The author has not received compensation for writing this article, other than from FXStreet.
FXStreet and the author do not provide personalized recommendations. The author makes no representations as to the accuracy, completeness, or suitability of this information. FXStreet and the author will not be liable for any errors, omissions or any losses, injuries or damages arising from this information and its display or use. Errors and omissions excepted.
The author and FXStreet are not registered investment advisors and nothing in this article is intended to be investment advice.
Recommended Content
Editors’ Picks

Shiba Inu eyes positive returns in April as SHIB price inches towards $0.000015
Shiba Inu's on-chain metrics reveal robust adoption, as addresses with balances surge to 1.4 million. Shiba Inu's returns stand at a solid 14.4% so far in April, poised to snap a three-month bearish trend from earlier this year.

AI tokens TAO, FET, AI16Z surge despite NVIDIA excluding crypto-related projects from its Inception program
AI tokens, including Bittensor and Artificial Superintelligence Alliance, climbed this week, with ai16z still extending gains at the time of writing on Friday. The uptick in prices of AI tokens reflects a broader bullish sentiment across the cryptocurrency market.

Bitcoin Weekly Forecast: BTC consolidates after posting over 10% weekly surge
Bitcoin price is consolidating around $94,000 at the time of writing on Friday, holding onto the recent 10% increase seen earlier this week. This week’s rally was supported by strong institutional demand, as US spot ETFs recorded a total inflow of $2.68 billion until Thursday.

XRP price could renew 25% breakout bid on surging institutional and retail adoption
Ripple price consolidates, trading at $2.18 at the time of writing on Friday, following mid-week gains to $2.30. The rejection from this weekly high led to the price of XRP dropping to the previous day’s low at $2.11, followed by a minor reversal.
Bitcoin Weekly Forecast: BTC consolidates after posting over 10% weekly surge
Bitcoin (BTC) price is consolidating around $94,000 at the time of writing on Friday, holding onto the recent 10% increase seen earlier this week.

The Best brokers to trade EUR/USD
SPONSORED Discover the top brokers for trading EUR/USD in 2025. Our list features brokers with competitive spreads, fast execution, and powerful platforms. Whether you're a beginner or an expert, find the right partner to navigate the dynamic Forex market.