- Shiba Inu price underwent a massive downswing but found support at $0.00000625.
- A resurgence of buying pressure at this barrier is likely to trigger a 40% upswing.
- If SHIB breaks below the $0.00000519 range low, it will invalidate the bullish thesis.
Shiba Inu price witnessed a huge correction after it failed to climb above a critical resistance level. This downswing seems to have exhausted after retesting a key foothold, which could lead to a trend reversal.
Shiba Inu price aims for a higher high
Shiba Inu price dropped roughly 35% after tagging the 62% Fibonacci retracement level at $0.00000955. The support zone, ranging from $0.00000625 to $0.00000654, absorbed the selling pressure and pushed SHIB higher. If the buying pressure continues to rise, Shiba Inu price will more than likely flip the $0.00000759 and $0.00000811 resistance barriers into support levels.
If such a move occurs, it will confirm the start of a comeback, and investors can expect SHIB to take another jab at the 62% Fibonacci retracement level at $0.00000654. A successful reclaim of this barrier will open the path to 70.5 Fibonacci retracement level at $0.0000101.
This move would constitute a roughly 40% upswing from the current position.
In some cases, Shiba Inu price might even make a run at $0.0000107, coinciding with the 79% Fibonacci retracement level.
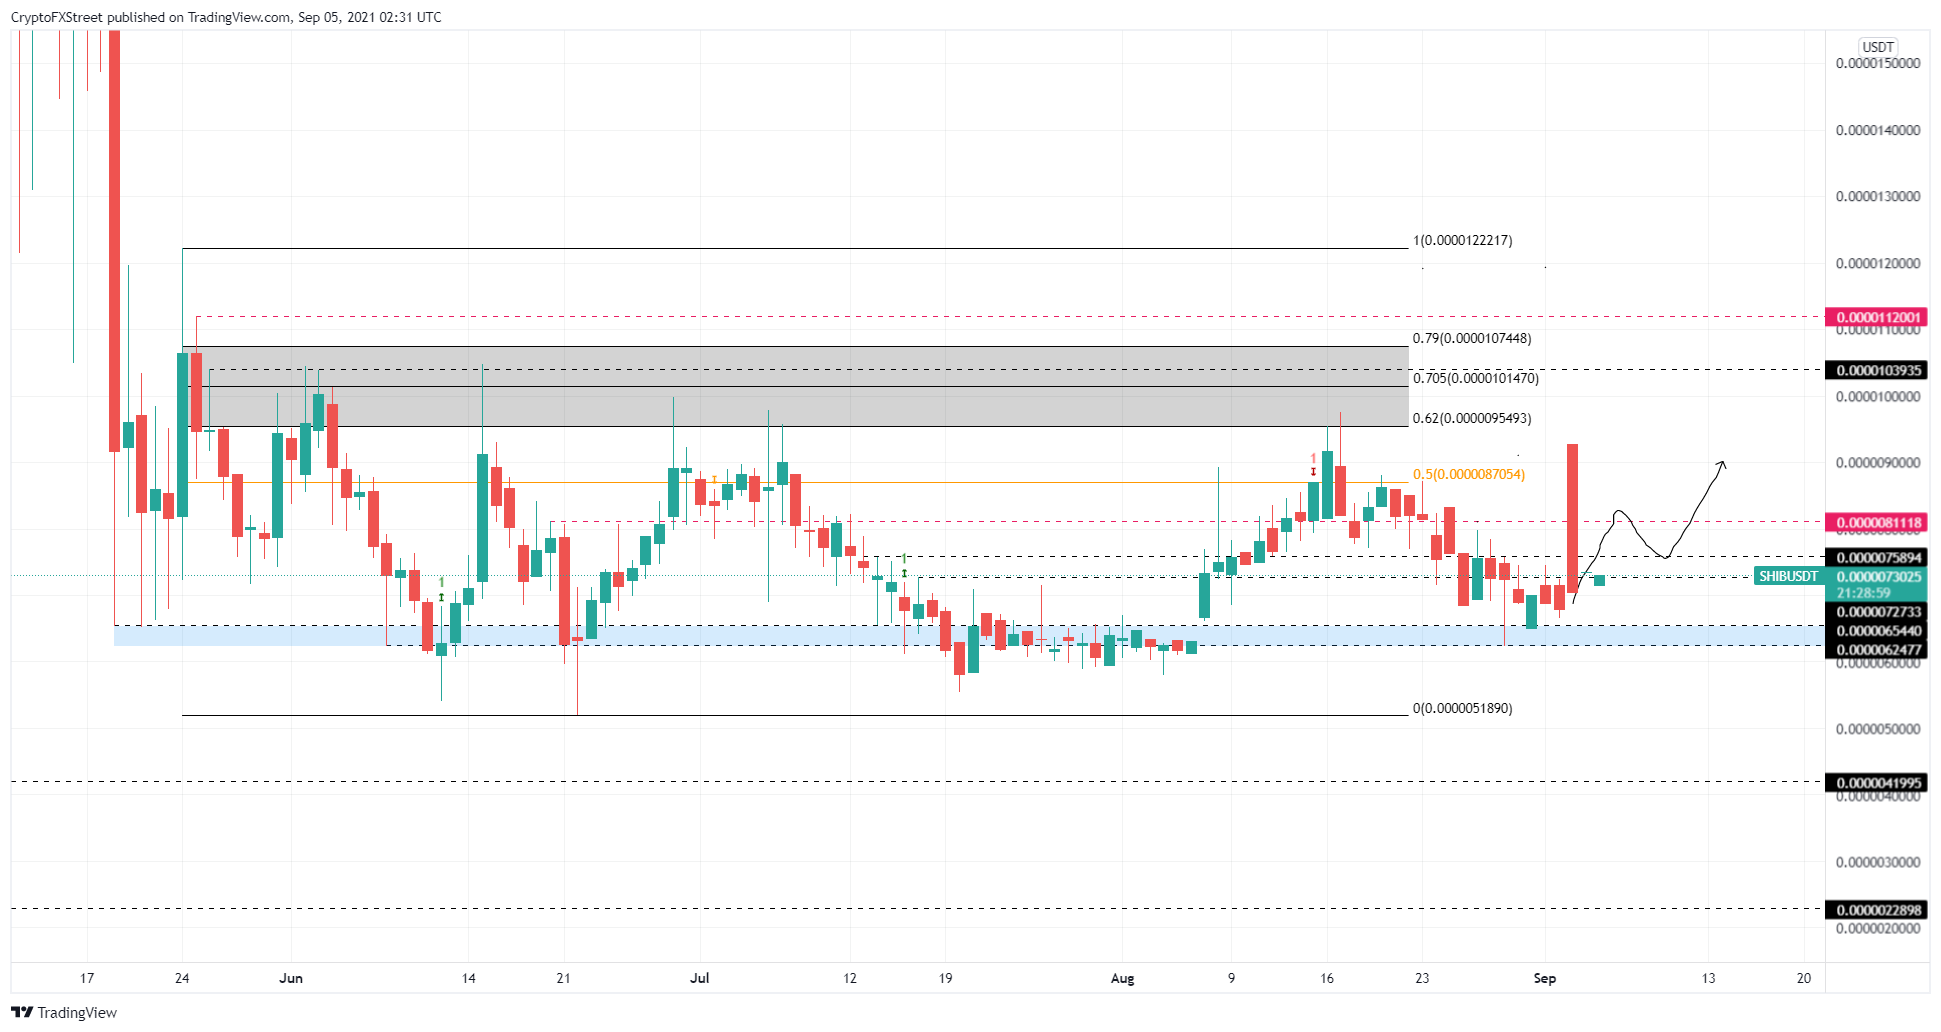
SHIB/USDT 1-day chart
While things look optimistic after the recent bounce from the $0.00000625 support level, investors need to keep an eye out for rejection at $0.00000811. Although the resulting downswing could bounce off the $0.00000625 foothold, a breakdown below it will invalidate the bullish thesis by setting up a lower low.
In this case, Shiba Inu price might crash 16% to tag the range low at $0.00000519.
Information on these pages contains forward-looking statements that involve risks and uncertainties. Markets and instruments profiled on this page are for informational purposes only and should not in any way come across as a recommendation to buy or sell in these assets. You should do your own thorough research before making any investment decisions. FXStreet does not in any way guarantee that this information is free from mistakes, errors, or material misstatements. It also does not guarantee that this information is of a timely nature. Investing in Open Markets involves a great deal of risk, including the loss of all or a portion of your investment, as well as emotional distress. All risks, losses and costs associated with investing, including total loss of principal, are your responsibility. The views and opinions expressed in this article are those of the authors and do not necessarily reflect the official policy or position of FXStreet nor its advertisers. The author will not be held responsible for information that is found at the end of links posted on this page.
If not otherwise explicitly mentioned in the body of the article, at the time of writing, the author has no position in any stock mentioned in this article and no business relationship with any company mentioned. The author has not received compensation for writing this article, other than from FXStreet.
FXStreet and the author do not provide personalized recommendations. The author makes no representations as to the accuracy, completeness, or suitability of this information. FXStreet and the author will not be liable for any errors, omissions or any losses, injuries or damages arising from this information and its display or use. Errors and omissions excepted.
The author and FXStreet are not registered investment advisors and nothing in this article is intended to be investment advice.
Recommended Content
Editors’ Picks

Monero Price Forecast: XMR soars over 19% amid rising demand for privacy coins
Monero (XMR) price is extending its gains by 19% at the time of writing on Monday, following a 9.33% rally the previous week. On-chain metrics support this price surge, with XMR’s open interest reaching its highest level since December 20.

Top 3 Price Prediction Bitcoin, Ethereum, Ripple: BTC and ETH stabilize while XRP shows strength
Bitcoin and Ethereum prices are stabilizing at around $93,500 and $1,770 at the time of writing on Monday, following a rally of over 10% and 12% the previous week. Ripple price also rallied 8.3% and closed above its key resistance level last week, indicating an uptrend ahead.

Ethereum Price Forecast: ETH ETFs post first weekly inflows since February
Ethereum (ETH) recovered the $1,800 price level on Saturday after US spot Ether ETFs (exchange-traded funds) recorded their first weekly inflows since February.

Defi Development Corporation files to offer $1 billion in securities to boost its Solana holdings
Defi Development Corporation (formerly Janover) filed a registration statement with the Securities & Exchange Commission (SEC) on Friday, signaling its intent to offer and sell a wide range of securities, including common and preferred stock, debt instruments and warrants for the purchase of equity

Bitcoin Weekly Forecast: BTC consolidates after posting over 10% weekly surge
Bitcoin (BTC) price is consolidating around $94,000 at the time of writing on Friday, holding onto the recent 10% increase seen earlier this week.

The Best brokers to trade EUR/USD
SPONSORED Discover the top brokers for trading EUR/USD in 2025. Our list features brokers with competitive spreads, fast execution, and powerful platforms. Whether you're a beginner or an expert, find the right partner to navigate the dynamic Forex market.