![]() Jonathan Morgan
Jonathan Morgan
Independent Analyst
- Shiba Inu price action shows surprising resiliency as major cryptos show bigger losses.
- SHIBA remains extremely bearish on the Ichimoku Chart, but the Point and Figure chart shows a bullish reversal in progress.
- Downside risks remain extensive if support fails to hold.
Shiba Inu price continues to trade lower but has stabilized relative to the rest of the cryptocurrency market. While the Ichimoku chart shows extremely bearish trading conditions, sellers have been unable or unwilling to capitalize on that weakness.
Shiba Inu price holds the $0.000022 support zone and prepares for a likely bullish extension move
Shiba Inu price action, from an Ichimoku perspective, is extremely bearish. SHIBA recently confirmed an Ideal Bearish Ichimoku Breakout last Friday (March 4, 2022) and has since traded lower, but not extensively. It is currently just above a prior resistance zone turned support at a $0.000022 value area.
$0.000022 is the primary support structure for Shiba Inu price before it would fall, and retest the lows of the January – February range in the $0.000020 price range. Below that, the Volume Profile is nearly empty, suggesting a swift move to the next high Volume Node, which doesn’t appear until 0.000008. While a move to that low is unlikely, it remains probable.
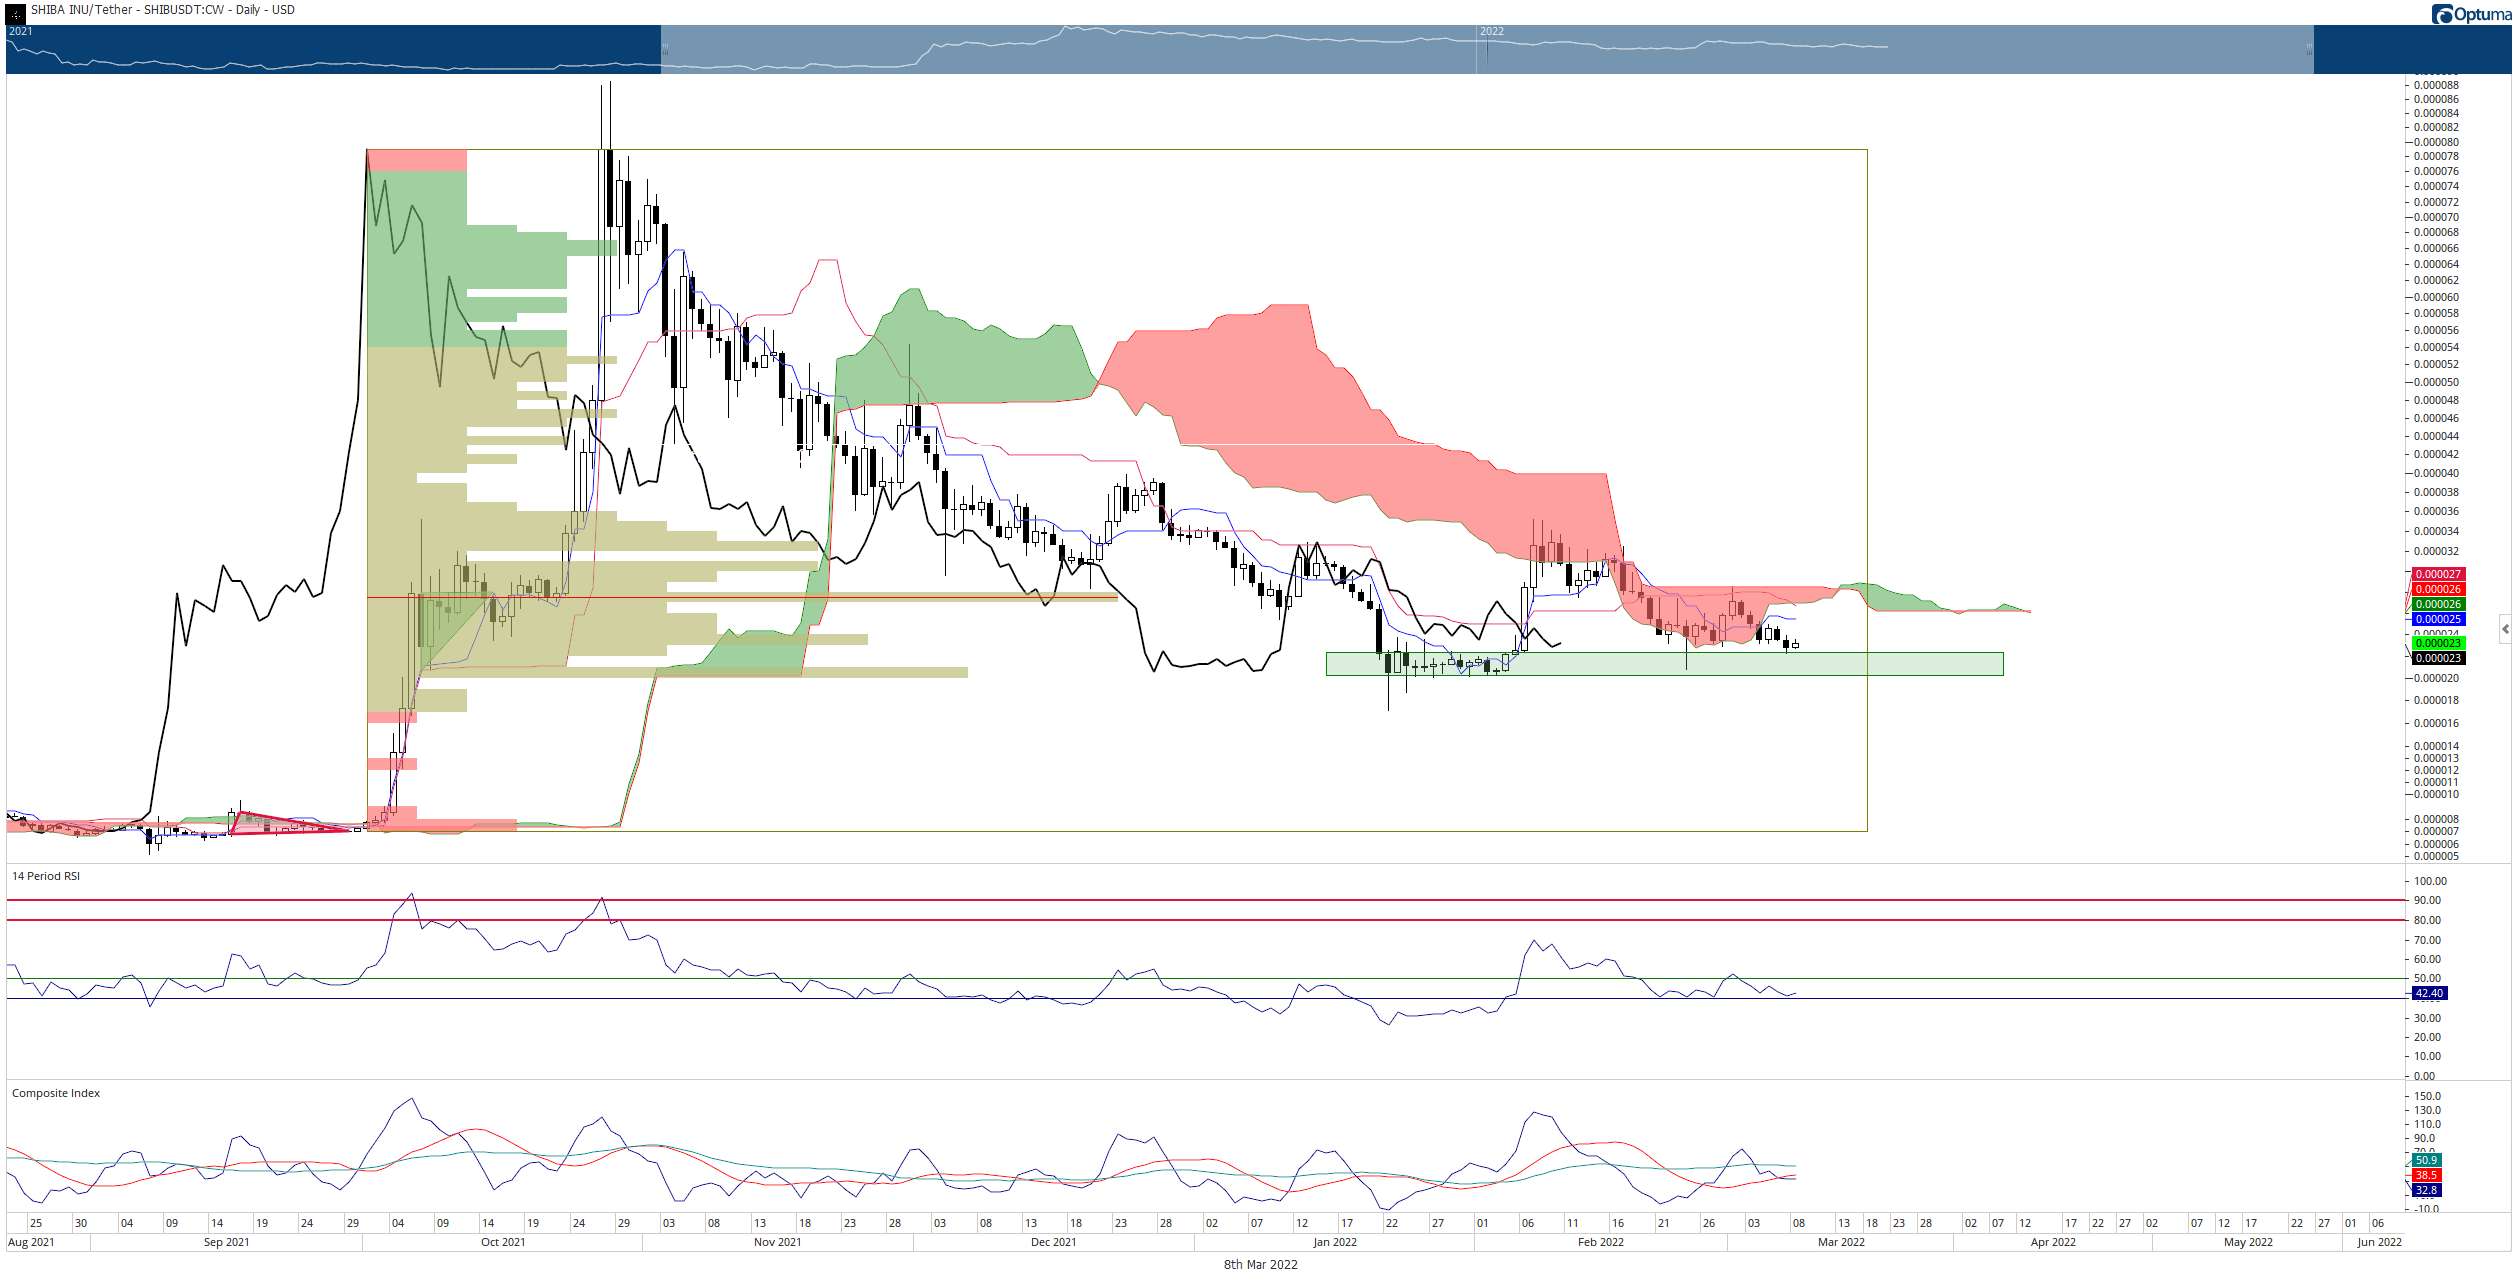
SHIBA/USDT Daily Ichimoku Kinko Hyo Chart
While the daily Ichimoku chart points to a bearish continuation as the most likely direction for Shiba Inu price, the Point and Figure chart show a different setup. The hypothetical long entry from several weeks ago remains valid.
The hypothetical long entry for Shiba Inu price was a buy stop order on the three-box reversal of Xs that formed off the previous O-column. That entry was triggered at $0.00002800. The entry is still valid. The stop loss is at $0.00001200, and the profit target is $0.00004540. The trade represents a 4.33:1 reward for the risk setup. A trailing stop of two to three boxes would help protect any profit made post entry.
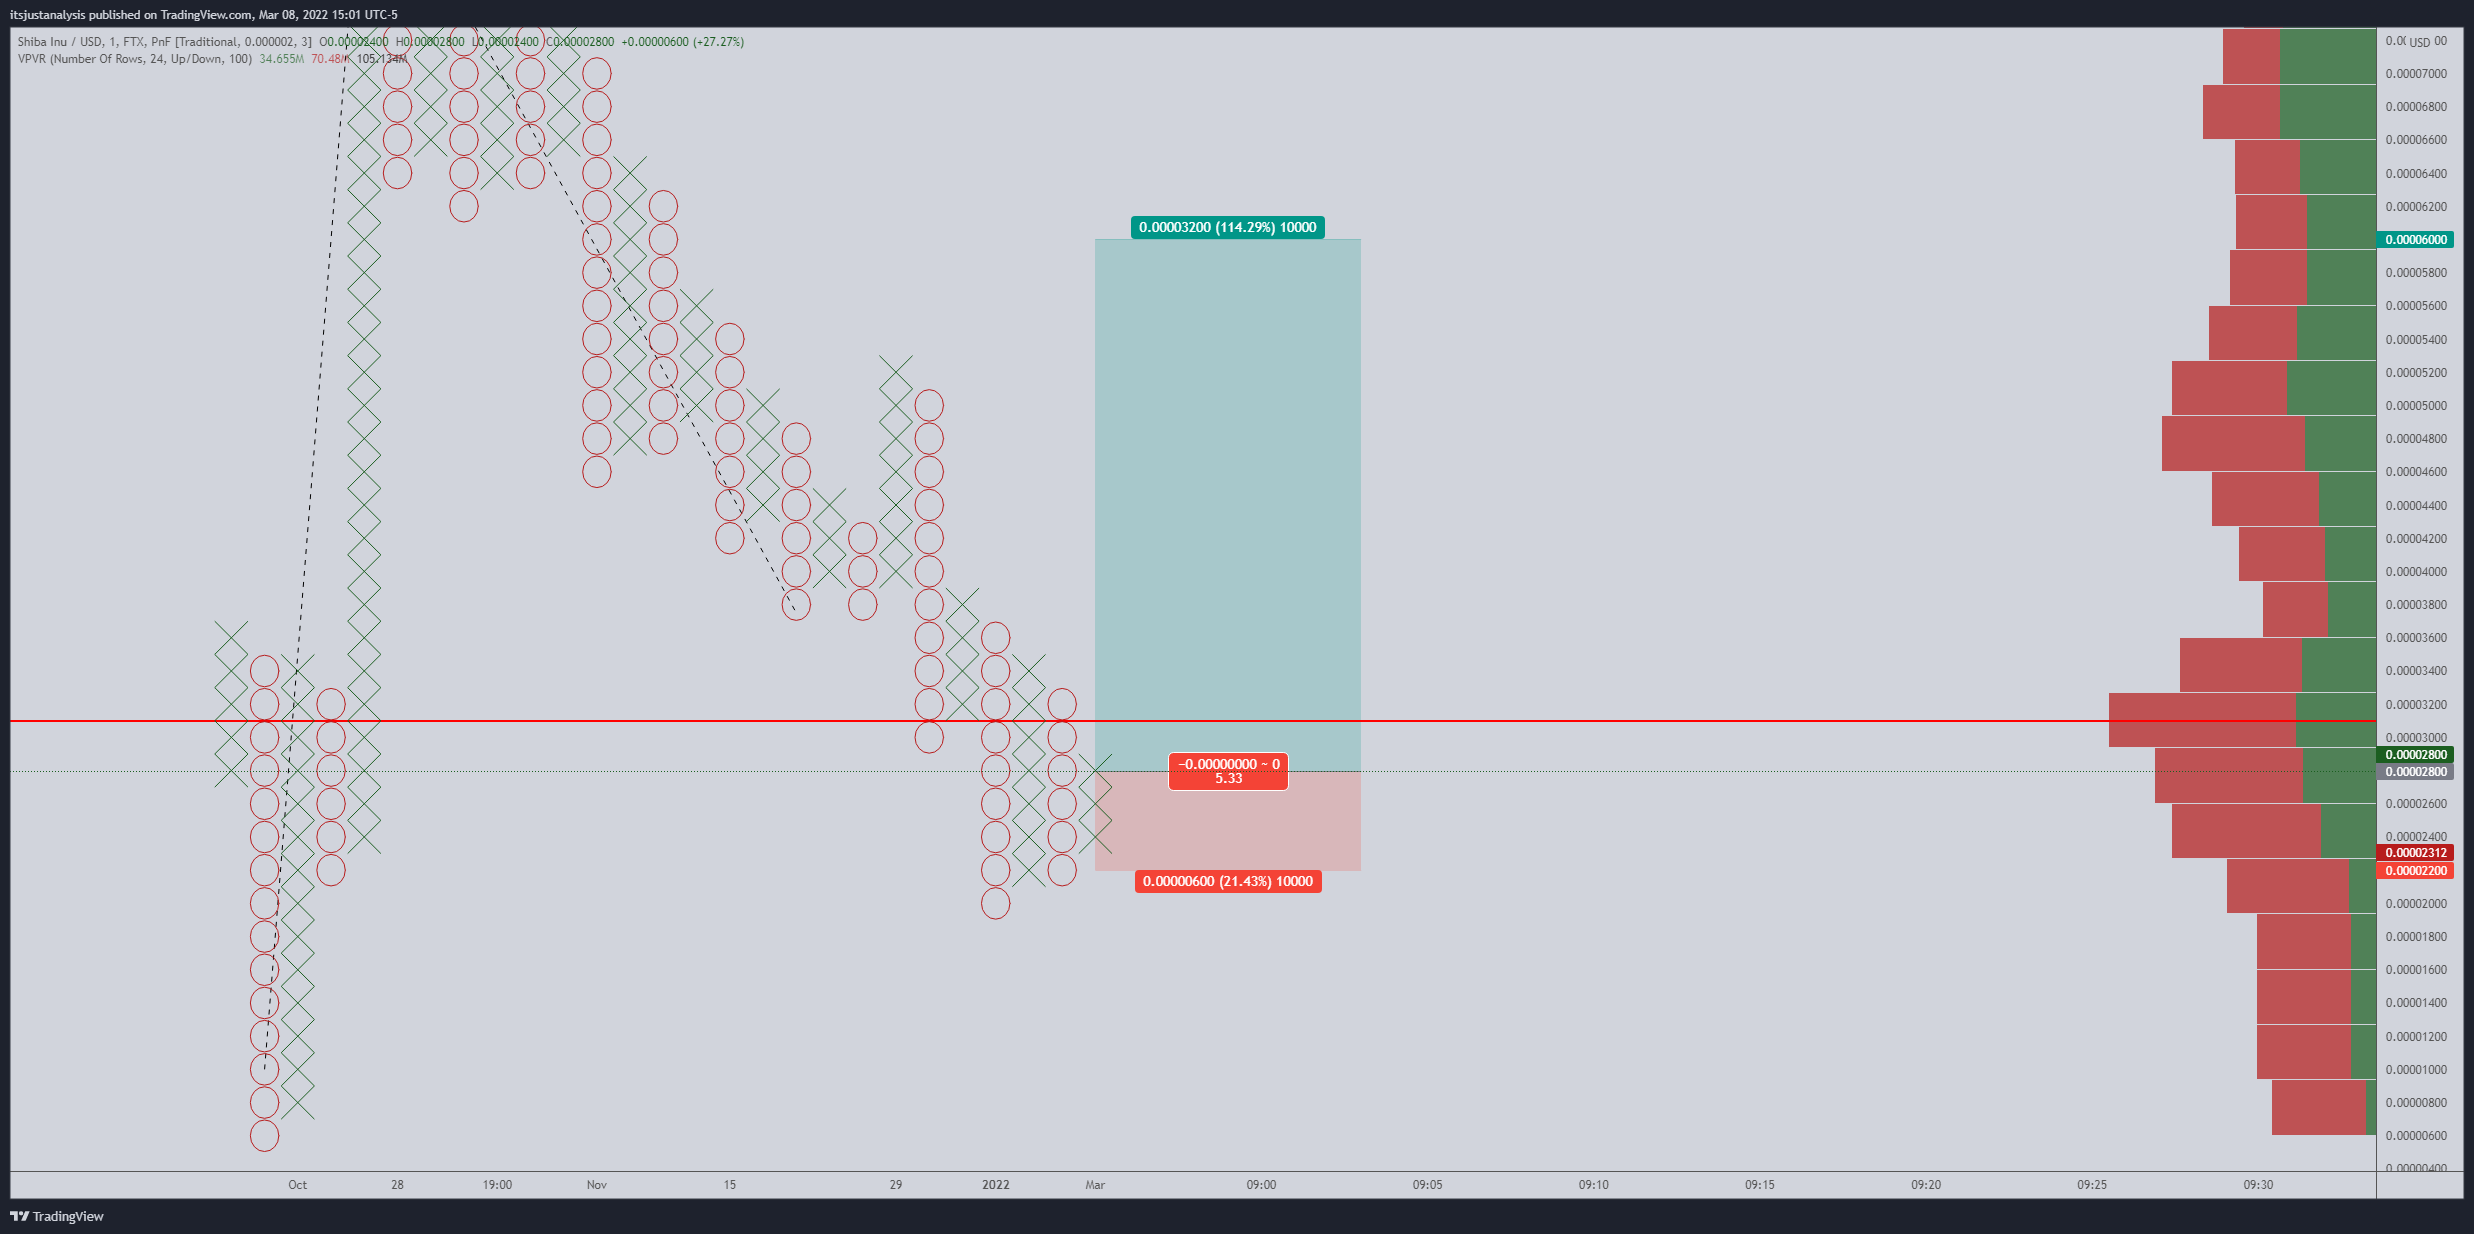
SHIBA/USDT $0.0000025/3-box Reversal Point and Figure Chart
The long trade idea is invalidated if Shiba Inu price falls to $0.000014 or lower before the entry is triggered. However, if SHIBA continues to move lower, the entry and stop-loss move in tandem – but the profit target remains the same.
Note: All information on this page is subject to change. The use of this website constitutes acceptance of our user agreement. Please read our privacy policy and legal disclaimer. Opinions expressed at FXstreet.com are those of the individual authors and do not necessarily represent the opinion of FXstreet.com or its management. Risk Disclosure: Trading foreign exchange on margin carries a high level of risk, and may not be suitable for all investors. The high degree of leverage can work against you as well as for you. Before deciding to invest in foreign exchange you should carefully consider your investment objectives, level of experience, and risk appetite. The possibility exists that you could sustain a loss of some or all of your initial investment and therefore you should not invest money that you cannot afford to lose. You should be aware of all the risks associated with foreign exchange trading, and seek advice from an independent financial advisor if you have any doubts.
Recommended Content
Editors’ Picks

Whale grabs 16,000 ETH as Ethereum Foundation vows support for L1, RWA and stablecoins
Ethereum Foundation's Co-Executive Director Tomasz K. Stańczak highlights simplified roadmap scaling blobs and improving L1 performance. Ethereum whale scoops 16,000 ETH, emphasizing growing interest in the token as the price recovers.

Bitcoin retests key resistance at $85K, breakout to $90K or rejection to $78K?
Bitcoin (BTC) price edges higher and approaches its key resistance at $85,000 on Monday, with a breakout indicating a bullish trend ahead. Metaplanet announced Monday that it purchased an additional 319 BTC, bringing its total holdings to 4,525 BTC.

XRP price teases breakout, bulls defend $2 support
Ripple (XRP) price grinds higher and trades at $2.15 during the early European session on Monday. The token sustained a bullish outlook throughout the weekend supported by bullish sentiment from the 90-day tariff suspension in the United States.

Senator Elizabeth Warren launches fresh offensive on crypto
Senators Elizabeth Warren, Mazie K. Hirono, and Dick Durbin want the DoJ’s decision to terminate crypto investigations reversed. The Senators raise concerns over the DoJ’s shift in priorities, terming it a “grave mistake.”

Bitcoin Weekly Forecast: Market uncertainty lingers, Trump’s 90-day tariff pause sparks modest recovery
Bitcoin (BTC) price extends recovery to around $82,500 on Friday after dumping to a new year-to-date low of $74,508 to start the week. Market uncertainty remains high, leading to a massive shakeout, with total liquidations hitting $2.18 billion across crypto markets.

The Best brokers to trade EUR/USD
SPONSORED Discover the top brokers for trading EUR/USD in 2025. Our list features brokers with competitive spreads, fast execution, and powerful platforms. Whether you're a beginner or an expert, find the right partner to navigate the dynamic Forex market.