- In a flat bearish candle, Shiba Inu price broke below the 200-day SMA last week.
- SHIB price got compressed this week and slid further to the downside as markets struggled to rebound.
- Expect a continuation of the downtrend to test this week's low at $0.00001708.
Shiba Inu (SHIB) price is not enjoying the past two weeks of price action is the price has slid to the downside, burning through roughly 40% of value. Although bulls have tried to catch the price action in SHIB for a turnaround, bears weigh too heavy on SHIB together with headwinds from global markets and geopolitics as main themes for the past week. Expect price action to slide further to the downside and go for a retest of $0.00001708, with bulls and investors awaiting the right sentiment in global markets to get involved.
Shiba Inu set for another drop between 5% to 10% before bulls will engage
Shiba Inu is not in a sweet spot and has not seen bulls stepping in to save the day, although there have been signs of bulls trying to overhaul the current trend. But headwinds coming from global markets have proven too big to overcome. The Fed tightening cycle announcement has scared investors and has brought a more subtle risk-off tone, which filters through in Nasdaq on the downside. This also proves why bulls have not overcome the current down march in SHIB price action.
SHIB price is technically not in a sweet spot either. As this week looks to be set to close below the 200-day Simple Moving Average at $0.00002495, that is to be conceived as a very bearish signal that could set the tone for more downside to come. It looks inevitable for next week that bears will keep the upper hand and will retest the low of last week at$0.00001708 for a retest and possible attempt for a break to the downside.
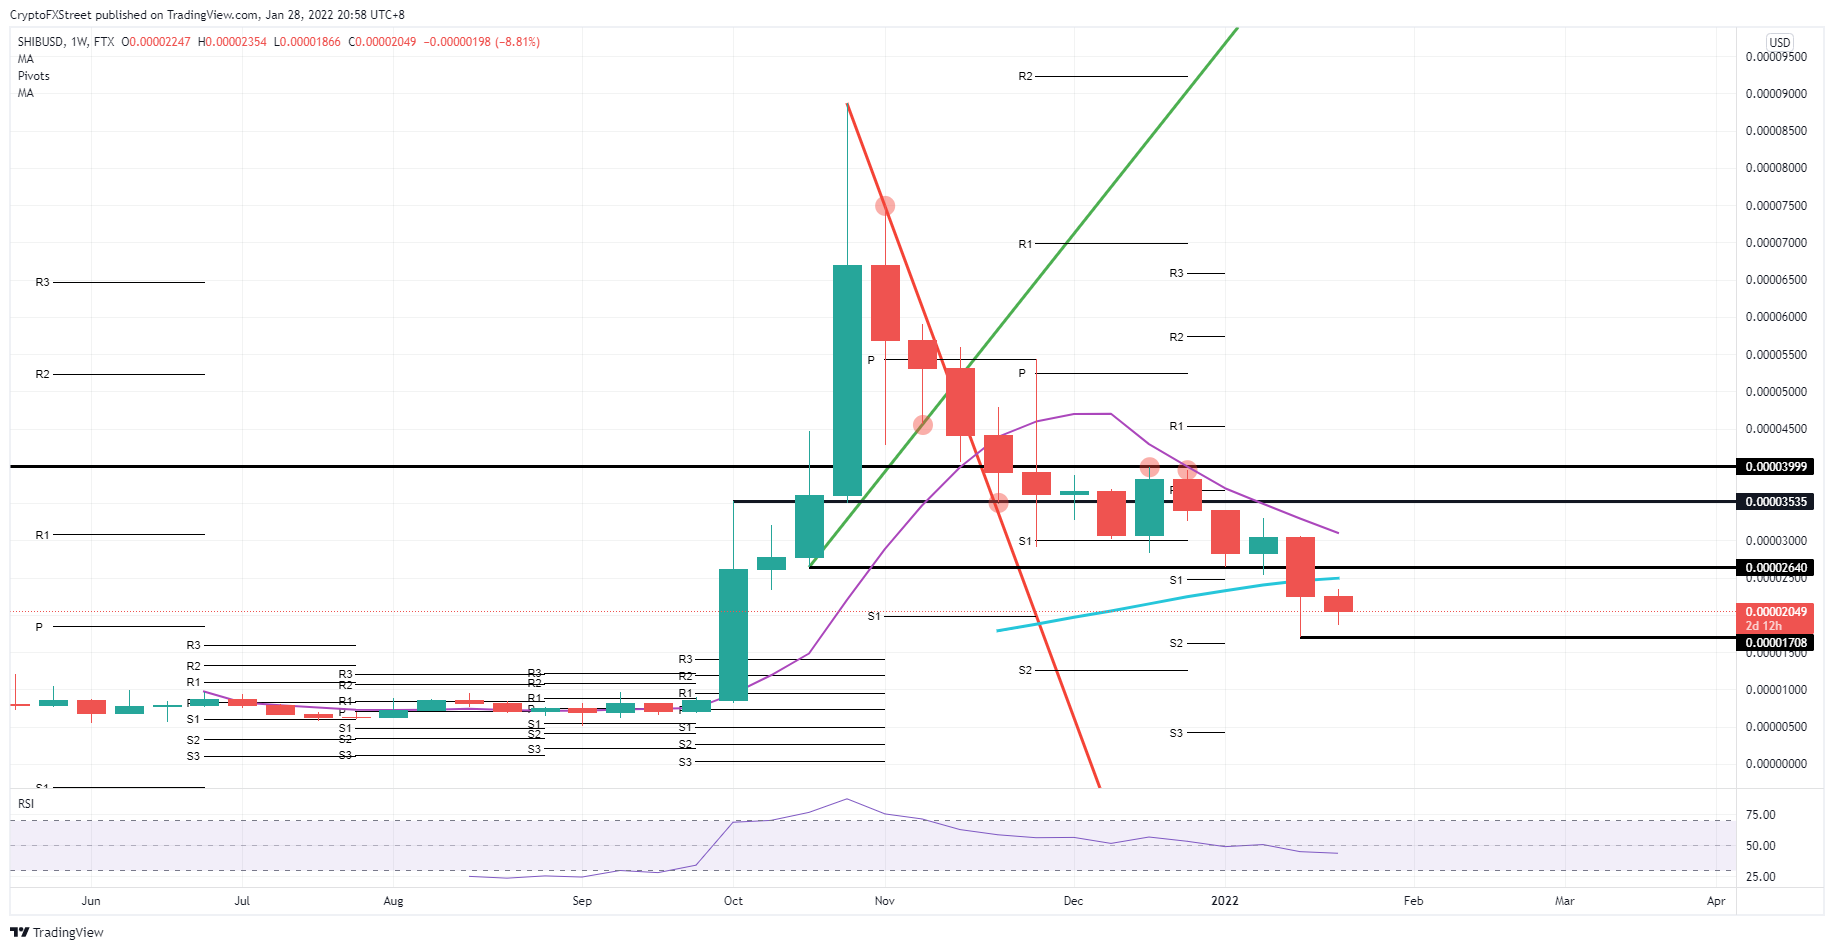
SHIB/USD weekly chart
It has often been the case that sooner or later, investors will look beyond the taper tantrum and will start to see the potential of cryptocurrencies, which will trigger a quick reversal and could push bears against $0.00002495 in the first phase. With bears pushed against the 200-day SMA, a quick breach could be triggered and hit $0.00002640 to the upside, taking out several stops from bears in the process.
Information on these pages contains forward-looking statements that involve risks and uncertainties. Markets and instruments profiled on this page are for informational purposes only and should not in any way come across as a recommendation to buy or sell in these assets. You should do your own thorough research before making any investment decisions. FXStreet does not in any way guarantee that this information is free from mistakes, errors, or material misstatements. It also does not guarantee that this information is of a timely nature. Investing in Open Markets involves a great deal of risk, including the loss of all or a portion of your investment, as well as emotional distress. All risks, losses and costs associated with investing, including total loss of principal, are your responsibility. The views and opinions expressed in this article are those of the authors and do not necessarily reflect the official policy or position of FXStreet nor its advertisers. The author will not be held responsible for information that is found at the end of links posted on this page.
If not otherwise explicitly mentioned in the body of the article, at the time of writing, the author has no position in any stock mentioned in this article and no business relationship with any company mentioned. The author has not received compensation for writing this article, other than from FXStreet.
FXStreet and the author do not provide personalized recommendations. The author makes no representations as to the accuracy, completeness, or suitability of this information. FXStreet and the author will not be liable for any errors, omissions or any losses, injuries or damages arising from this information and its display or use. Errors and omissions excepted.
The author and FXStreet are not registered investment advisors and nothing in this article is intended to be investment advice.
Recommended Content
Editors’ Picks

Grayscale files S-3 form for Digital Large Cap ETF comprising Bitcoin, Ethereum, XRP, Solana, and Cardano
Grayscale, a leading digital asset manager operating the GBTC ETF, has filed the S-3 form with the United States (US) Securities and Exchange Commission (SEC) in favor of a Digital Large Cap ETF.

Top 3 Price Prediction Bitcoin, Ethereum, Ripple: BTC, ETH, and XRP brace for volatility amid Trump’s ‘Liberation Day’
Bitcoin price faces a slight rejection around its $85,000 resistance level on Wednesday after recovering 3.16% the previous day. Ripple follows BTC as it falls below its critical level, indicating weakness and a correction on the horizon.

Top crypto news: VanEck hints at BNB ETF, Circle files S-1 application for IPO
Asset manager VanEck registered a BNB Trust in Delaware on Tuesday, marking its intention to register for an ETF product with the Securities & Exchange Commission (SEC).

Solana Price Forecast for April 2025: SOL traders risk $120 reversal as FTX begins $800M repayments on May 30
Solana price consolidated below $130 on Tuesday, facing mounting headwinds in April as investors grow wary of looming FTX sell-offs.

Bitcoin: BTC remains calm before a storm
Bitcoin's price has been consolidating between $85,000 and $88,000 this week. A K33 report explains how the markets are relatively calm and shaping up for volatility as traders absorb the tariff announcements. PlanB’s S2F model shows that Bitcoin looks extremely undervalued compared to Gold and the housing market.

The Best brokers to trade EUR/USD
SPONSORED Discover the top brokers for trading EUR/USD in 2025. Our list features brokers with competitive spreads, fast execution, and powerful platforms. Whether you're a beginner or an expert, find the right partner to navigate the dynamic Forex market.