Shiba Inu price set to crash by 70% as critical support weakens
- Shiba Inu price sees bears drilling down on an important area of support.
- SHIB price could see a nose dive reaction later today should the US session see accelerated selloffs.
- A break below the 200-day SMA could hold 70% of losses before plenty of support is found.
Shiba Inu (SHIB) price continues to be controlled by bears after the dead-cat bounce in stock markets yesterday evening. With the Nasdaq closing sharply lower, giving up earlier gains, cryptocurrencies are being dragged into a selloff on its coattails, and bearish headwinds persist. Expect a further continuation of downside tests, with $0.00002576, up next, and a break below that opening up the possibility of SHIB price being decimated towards $0.00000655 – a 70% devaluation.
Shiba Inu hanging by a thread before price action could collapse
Shiba Inu price is in a vortex along with other financial market assets, after the US session saw a180 degree U-turn to the downside. The ASIA PAC and European sessions are also sharply lower and with risk assets being slashed across the board. This is being reflected in cryptocurrencies where a selloff is also taking place.
At the moment, SHIB price is drilling down to $0.00002482, a level where the 200-day Simple Moving Average (SMA) and the monthly S1 support level intersect. This should offer plenty of support, but with current market sentiment so negative, it is not a given that investors will want to step in and support the trade. A break lower would see price next pause at $0.00001623, the S2 monthly support.
The level of the S2 does not hold any historical relevance, however, making it relatively weak, and the only key level further down looks to be $0.00000607, just above the S3 monthly support, and the starting point of a Fibonacci retracement. Depending on how the US session will unfold, expect this to be on the cards in the days to come if markets enter into correction territory or even into a recession. The result would be SHIB shedding 70% of its market value from where it is currently trading.
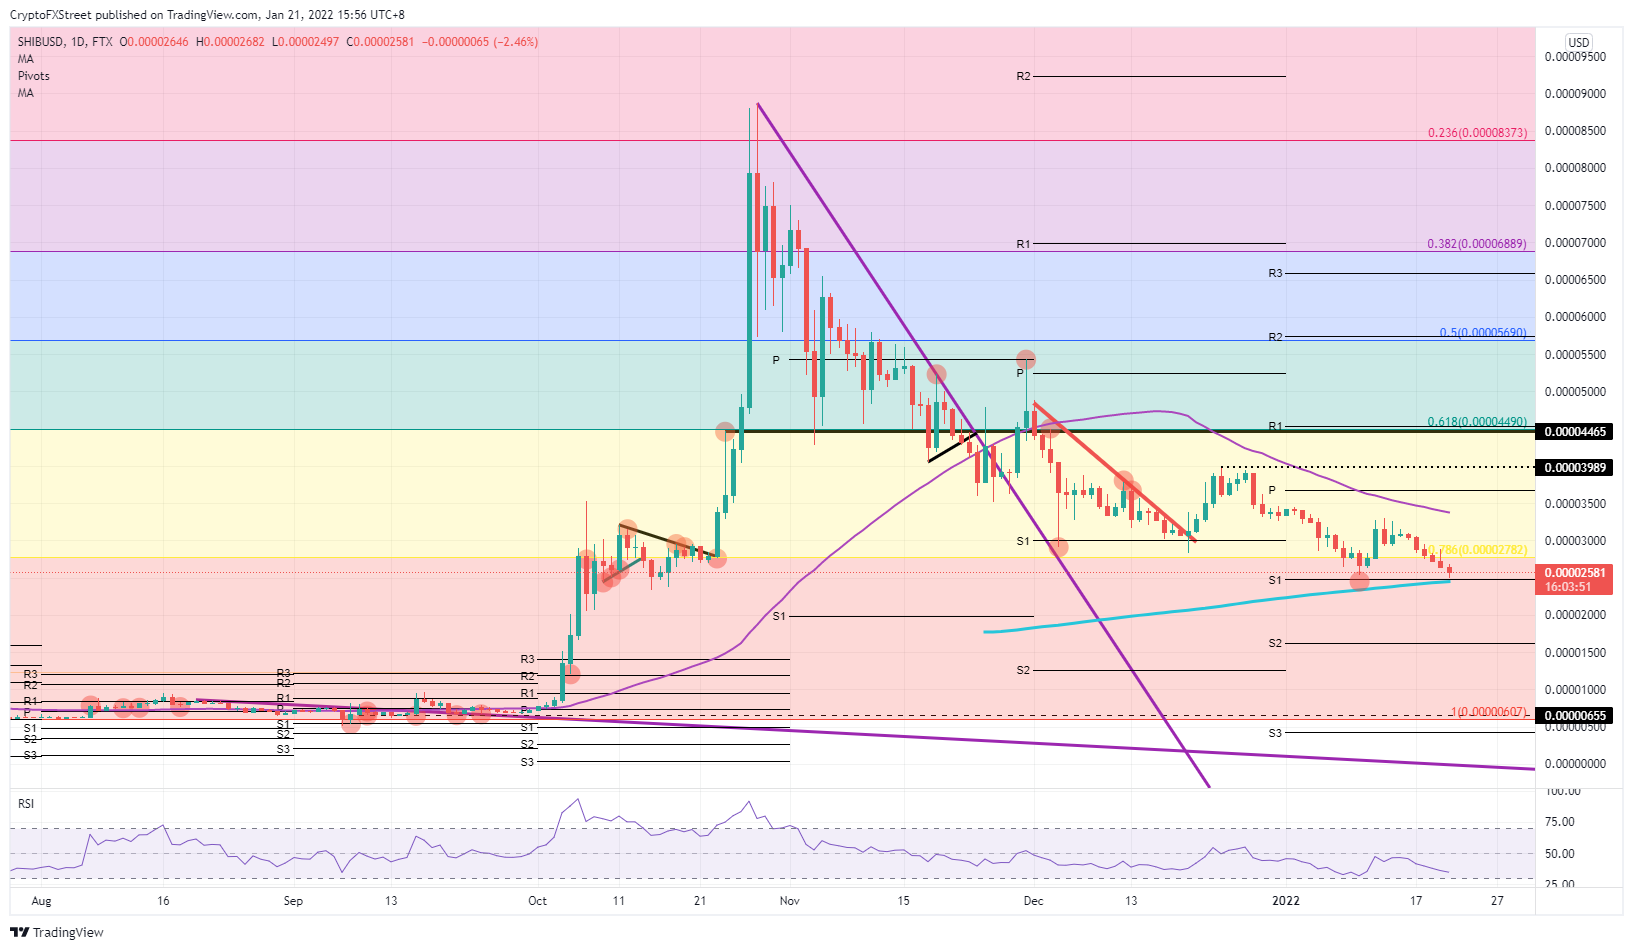
SHIB/USD daily chart
Often enough, markets see an uptick after a gloomy negative day like yesterday. Investors start to come in and pick up interesting assets at a discount, and markets finally get to a point where a revaluation trade is made. This could be the same for Shiba Inu, with the 200-day SMA holding its ground, supporting price action, and a bullish candle starting to form with a test at the 55-day SMA around $0.00003395.
Author

Filip Lagaart
FXStreet
Filip Lagaart is a former sales/trader with over 15 years of financial markets expertise under its belt.


