- Shiba Inu price ticks up 1% during European trading.
- SHIB price is set to attack the red descending trend line as the US Dollar flirts with new highs.
- Expect a jump but plenty of technical headwinds before the road is cleared to the upside.
Shiba Inu (SHIB) price action is set to continue its bullish path as whales are finally entering the trading action. Tuesday night's explosion in Poland saw SHIB price being unfazed, meaning that traders in their positions are sticking to their guns to see this through. Although the first cap needs to be taken, there are several technical elements to the upside before traders can relax and see a solid continuous rally unfold.
SHIB price could rally substantially if it can overcome these challenges
Shiba Inu price action is seeing momentum swinging in its favor as markets eagerly trade on the weaker US Dollar, which was the omen for most of 2022 in several asset classes. Cryptocurrencies as a group have been enjoying the big drop in the Greenback this week and are booking gains on the back of it. With more cash and big whales mixing into SHIB price action, expect to see a pop higher should the red descending trend line break to the upside under pressure that is building up as we speak.
SHIB price action would still face two additional hurdles on the topside before traders can start sitting on their hands and see a broader stretched rally continue. That first challenge will come from the 55-day Simple Moving Average (SMA) at $0.00001080, which holds importance for most of October. The last one is the 200-day SMA at $0.00001180, which has been chopped up at the beginning of this month and, as it has been weakened, could be taken out should the US Dollar weaken further.
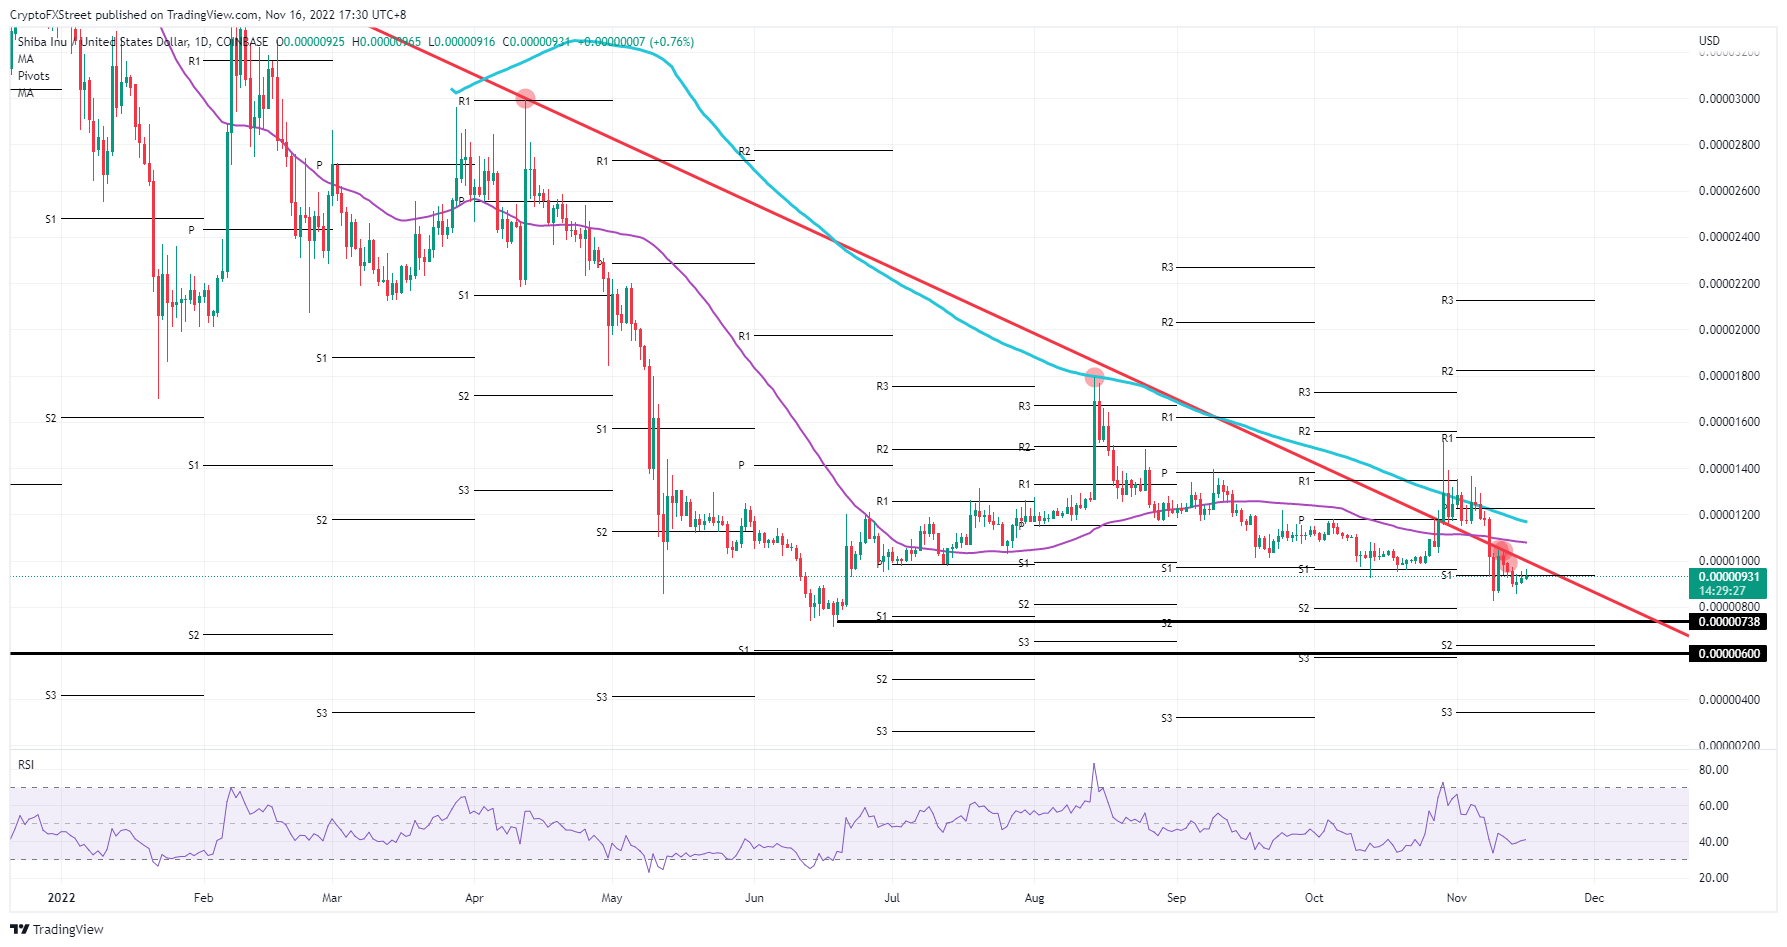
SHIB/USD daily chart
It must be underlined that markets are reacting on the back of lower US inflation and a lower Producer Price Index reading from Tuesday, which triggered the second round of US Dollar weakness. Markets are missing the detail here that both metrics measured October; thus, it is quite normal that they both bore a lower print. It will take more than that before the Fed takes the foot off the gas pedal. When the Fed delivers that message at upcoming events, expect to see SHIB price drop back below $0.00001000 and test $0.00000738 to the downside.
Information on these pages contains forward-looking statements that involve risks and uncertainties. Markets and instruments profiled on this page are for informational purposes only and should not in any way come across as a recommendation to buy or sell in these assets. You should do your own thorough research before making any investment decisions. FXStreet does not in any way guarantee that this information is free from mistakes, errors, or material misstatements. It also does not guarantee that this information is of a timely nature. Investing in Open Markets involves a great deal of risk, including the loss of all or a portion of your investment, as well as emotional distress. All risks, losses and costs associated with investing, including total loss of principal, are your responsibility. The views and opinions expressed in this article are those of the authors and do not necessarily reflect the official policy or position of FXStreet nor its advertisers. The author will not be held responsible for information that is found at the end of links posted on this page.
If not otherwise explicitly mentioned in the body of the article, at the time of writing, the author has no position in any stock mentioned in this article and no business relationship with any company mentioned. The author has not received compensation for writing this article, other than from FXStreet.
FXStreet and the author do not provide personalized recommendations. The author makes no representations as to the accuracy, completeness, or suitability of this information. FXStreet and the author will not be liable for any errors, omissions or any losses, injuries or damages arising from this information and its display or use. Errors and omissions excepted.
The author and FXStreet are not registered investment advisors and nothing in this article is intended to be investment advice.
Recommended Content
Editors’ Picks

Top gainers Virtuals Protocol, Floki, Hyperliquid: Altcoins extend gains alongside Bitcoin
The cryptocurrency market sustains a market-wide bullish outlook at the time of writing on Tuesday, led by Bitcoin (BTC) and select altcoins, including Virtuals Protocol (VIRTUAL), Floki, and Hyperliquid (HYPE).

Token unlocks over $625 million this week across major projects SUI, OP, SOL, AVAX and DOGE
According to Wu Blockchain, 11 altcoins with one-time tokens unlock more than $5 million each in the next seven days. The total value of cliff and linear unlocked tokens exceeds $625 million.

TRUMP meme coin on-chain activity surged following dinner announcement: Kaiko
Kaiko Research published a report on Monday highlighting the significant impact of TRUMP's team dinner announcement on the meme coin sector. The announcement triggered a surge in on-chain activity and trading volumes, with TRUMP accounting for nearly 50% of all meme coin trading volume.

Coinbase launches new Bitcoin Yield Fund, offering investors 4–8% annual returns
Coinbase has launched a Bitcoin Yield Fund, aiming to offer non-U.S. investors sustainable 4–8% returns paid directly in Bitcoin.

Bitcoin Weekly Forecast: BTC consolidates after posting over 10% weekly surge
Bitcoin (BTC) price is consolidating around $94,000 at the time of writing on Friday, holding onto the recent 10% increase seen earlier this week.

The Best brokers to trade EUR/USD
SPONSORED Discover the top brokers for trading EUR/USD in 2025. Our list features brokers with competitive spreads, fast execution, and powerful platforms. Whether you're a beginner or an expert, find the right partner to navigate the dynamic Forex market.