- Shiba Inu price broke an essential trendline during the Asian session this morning.
- Overall, major cryptocurrencies like Bitcoin and Ethereum are in negative territory on Monday.
- A redip to $0.000008 would present the right buying opportunity for SHIB.
Shiba Inu price made an impressive jump this past weekend, together with most other cryptocurrencies. But it looks like profit-taking is already in full gear this morning for SHIB.
Shiba Inu bulls prepare to buy the dip
Over the weekend, the cryptocurrency was very much in the green across the board. Higher cap tokens were leading the way, with Bitcoin up almost 5%. But during the Asian session on Monday morning, profit-taking took over. Sentiment turned sour and made other cryptocurrencies like Shiba Inu dip lower.
The spike in profit-taking this morning saw Shiba Inu price drop from $0.00000895, erasing almost all the profits made since Saturday morning. Although SHIB had a bounce off the black ascending trend line toward $0.00000878 over the weekend, this support level got broken and prices dipped lower toward $0.00000837, where it started Saturday morning.
Shiba Inu price managed to stay above that level for now. But the question is, “For how long?”. With the top cryptocurrencies not pairing their losses, a false breakout looks like it is in the making.
Next to that, the general sentiment in the markets this morning was not positive. With the US markets closed for the holiday, US equity futures are all in the red this morning. With low volume, no natural recovery is expected today.
SHIB can thus still go another leg lower with buyers on the sidelines. On the downside, we already discussed $0.00000837, which matches the 61.8% Fibonacci level. A test of the 78.6% level would be interesting as this is where buyers stepped in on Friday night.
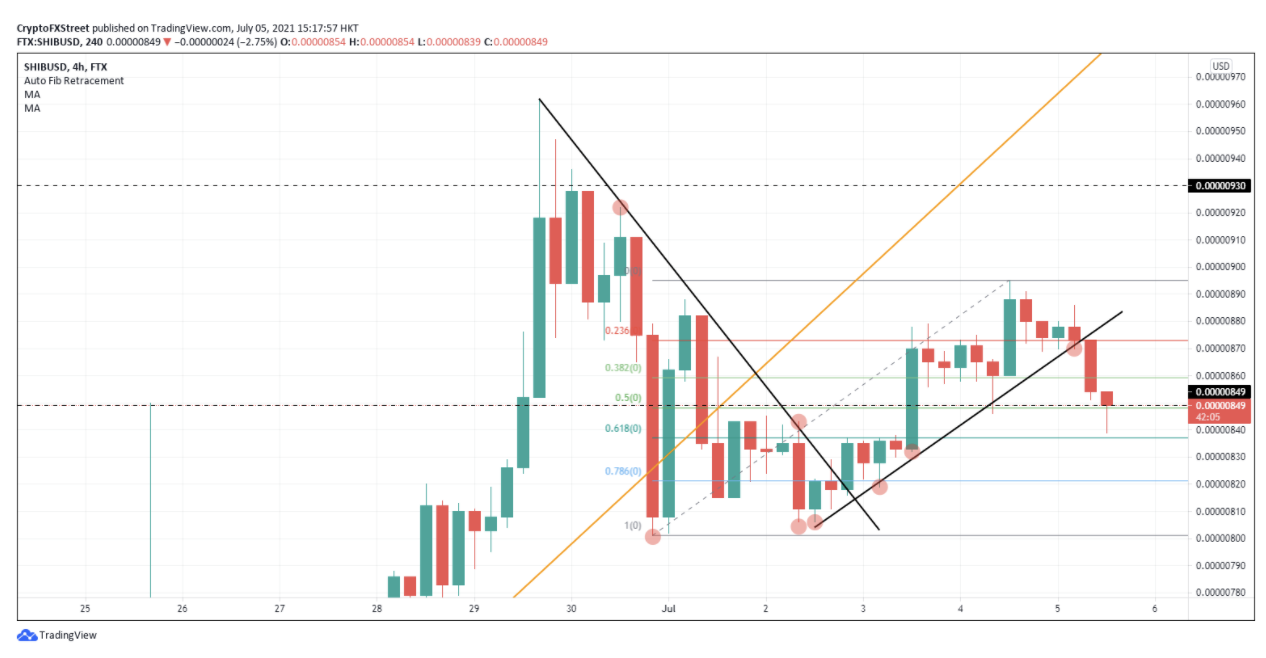
SHIB/USD 4-hour chart
To the upside, a retest of the 23.6% Fibonacci level at $0.00000873 would be proof that more upside is yet to come.
Shiba Inu price will certainly pair losses as, overall, nothing has changed the risk sentiment. It is just crucial to wait for the right approach as buyers step in. As said, either $0.00000820 or $0.00000837 are the two key levels to watch for a long.
Should more downward pressure and more selling be coming in today, expect a complete retrace of the move toward $0.0000080 before buyers enter in full.
Information on these pages contains forward-looking statements that involve risks and uncertainties. Markets and instruments profiled on this page are for informational purposes only and should not in any way come across as a recommendation to buy or sell in these assets. You should do your own thorough research before making any investment decisions. FXStreet does not in any way guarantee that this information is free from mistakes, errors, or material misstatements. It also does not guarantee that this information is of a timely nature. Investing in Open Markets involves a great deal of risk, including the loss of all or a portion of your investment, as well as emotional distress. All risks, losses and costs associated with investing, including total loss of principal, are your responsibility. The views and opinions expressed in this article are those of the authors and do not necessarily reflect the official policy or position of FXStreet nor its advertisers. The author will not be held responsible for information that is found at the end of links posted on this page.
If not otherwise explicitly mentioned in the body of the article, at the time of writing, the author has no position in any stock mentioned in this article and no business relationship with any company mentioned. The author has not received compensation for writing this article, other than from FXStreet.
FXStreet and the author do not provide personalized recommendations. The author makes no representations as to the accuracy, completeness, or suitability of this information. FXStreet and the author will not be liable for any errors, omissions or any losses, injuries or damages arising from this information and its display or use. Errors and omissions excepted.
The author and FXStreet are not registered investment advisors and nothing in this article is intended to be investment advice.
Recommended Content
Editors’ Picks

Cardano Price Forecast: Sign of robust bullish reversal emerges despite dwindling DeFi TVL volume
Cardano rebounds to test resistance at $0.69 as technical indicator flashes a buy signal. A minor increase in the derivative Open Interest to $831 million suggests growing trader interest in ADA.
Crypto Today: Bitcoin's downside risks escalate as BTC spot ETF outflows extend
The cryptocurrency market is consolidating losses after starting the week amid high volatility. Bitcoin attempted to steady the uptrend above $106,000 but lost steam, resulting in a reversal to $105,204 at the time of writing on Tuesday.

Bitcoin falls below $106,000 as risk-off sentiment persists
Bitcoin price faces rejection around its $106,406 resistance level on Tuesday, hinting at a potential correction ahead. Market sentiment sours as growing Israel-Gaza tensions weigh on riskier assets, such as BTC.

Coinbase asset roadmap adds Ethena, ENA targets $0.34 breakout before listing
Ethena records its fourth consecutive positive day, signaling increased bullish momentum. Coinbase announces the addition of Ethena to the asset roadmap, making it tradable on the platform soon.

Bitcoin: BTC dips as profit-taking surges, but institutional demand holds strong
Bitcoin (BTC) is stabilizing around $106,000 on Friday, following three consecutive days of correction that have resulted in a near 3% decline so far this week. The correction in BTC prices was further supported by the profit-taking activity of its holders, which has reached a three-month high.

The Best brokers to trade EUR/USD
SPONSORED Discover the top brokers for trading EUR/USD in 2025. Our list features brokers with competitive spreads, fast execution, and powerful platforms. Whether you're a beginner or an expert, find the right partner to navigate the dynamic Forex market.