- Shiba Inu price starts to erase its 24-hour gains after running into selling pressure at the 50-day EMA.
- SHIB remains fundamentally weak to rally amid a persistent drop in active addresses.
- Buyers will likely arrest Shiba Inu’s losses at $0.00000880 and pave the way for a significant recovery to $0.00001024.
Shiba Inu (SHIB) price has suddenly snapped out of a bullish mid-week stint which experts believe came from extremely oversold market conditions. The second-largest meme coin printed several green candles before tapping out at $0.00000911. Bears will likely push SHIB down to its primary support at $0.00000830 if declines are not arrested on time.
Shiba Inu price analysis as trading volume drops to $173M
Shiba Inu price is recording a 16.73% drop in trading volume across all cryptocurrency exchanges despite its mid-week rebound. According to CoinMarketCap, $173 million was traded in 24 hours. This downtrend in volume had persisted since November 10, when the $625 million was traded.
The slow trend could be a product of decreased network activity, as highlighted by the Daily Active Addresses on-chain metric from Santiment. Only 3,572 addresses have interacted with SHIB on the protocol compared to a 30-day peak of 14,363, recorded on November 13.
 [17.41.26, 23 Nov, 2022]-638048168060011946.png)
Shiba Inu Daily Active Addresses
The FTX crisis continues to keep investors and traders away from crypto markets. A consistent southbound trend in the number of daily addresses actively transacting on the blockchain provides a sneak peek into the level of speculation among investors. Therefore, Shiba Inu price could only recover if retail investors make a strong comeback.
Bears snuff out SHIB’s bullish spark
Shiba Inu price did not manage to break and hold above the resistance provided by the 50-day Exponential Moving Average (EMA) (in red) at $0.00000902, possibly due to early profit booking by investors who are too anxious to wait, thanks to the FTX contagion.
SHIB trades at $0.00000892 while looking forward to resting on relatively higher support. The falling trend line is the first support candidate at $0.00000880, but declines could stretch to the primary support at $0.00000830.
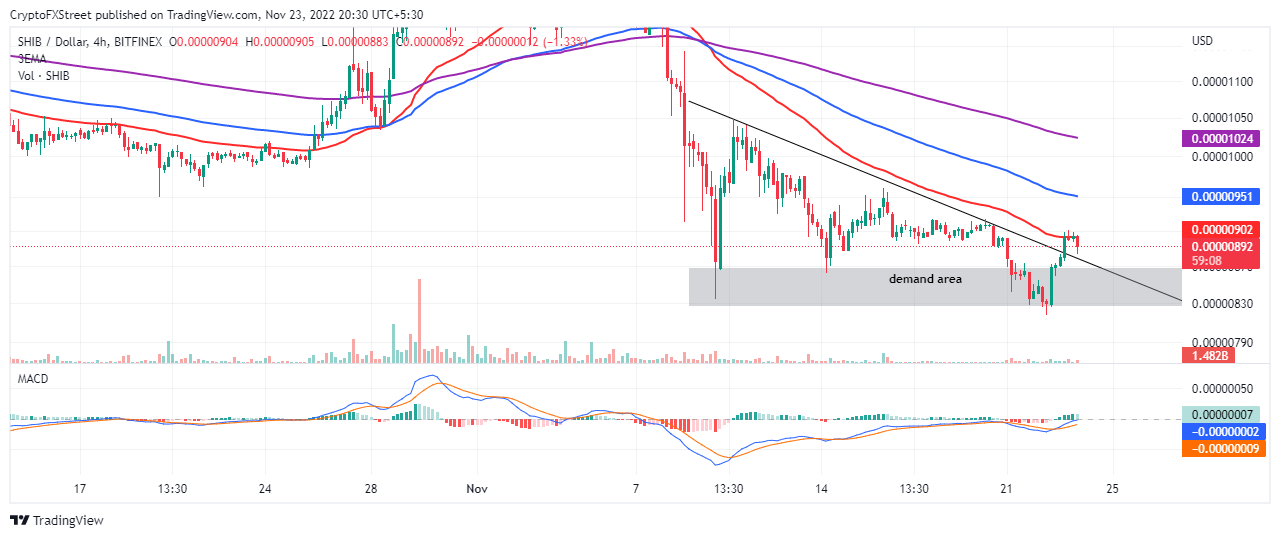
SHIB/USD four-hour chart
At the moment Shiba Inu price lacks enough momentum to change the outlook from bearish to bullish, hence, buyers should pay attention to a buy signal from the Moving Average Convergence Divergence (MACD) indicator.
Buy orders can be triggered above the 50-day EMA using the MACD’s movement above the mean line (0.00) into the positive territory as a confirmation signal. Profit booking can potentially occur at the 100-day EMA (in blue) around $0.00000951 and the 200-day EMA (in purple), holding the ground at $0.00001024.
Information on these pages contains forward-looking statements that involve risks and uncertainties. Markets and instruments profiled on this page are for informational purposes only and should not in any way come across as a recommendation to buy or sell in these assets. You should do your own thorough research before making any investment decisions. FXStreet does not in any way guarantee that this information is free from mistakes, errors, or material misstatements. It also does not guarantee that this information is of a timely nature. Investing in Open Markets involves a great deal of risk, including the loss of all or a portion of your investment, as well as emotional distress. All risks, losses and costs associated with investing, including total loss of principal, are your responsibility. The views and opinions expressed in this article are those of the authors and do not necessarily reflect the official policy or position of FXStreet nor its advertisers. The author will not be held responsible for information that is found at the end of links posted on this page.
If not otherwise explicitly mentioned in the body of the article, at the time of writing, the author has no position in any stock mentioned in this article and no business relationship with any company mentioned. The author has not received compensation for writing this article, other than from FXStreet.
FXStreet and the author do not provide personalized recommendations. The author makes no representations as to the accuracy, completeness, or suitability of this information. FXStreet and the author will not be liable for any errors, omissions or any losses, injuries or damages arising from this information and its display or use. Errors and omissions excepted.
The author and FXStreet are not registered investment advisors and nothing in this article is intended to be investment advice.
Recommended Content
Editors’ Picks

Dogecoin and Bitcoin Cash Price Prediction: Funding rates decrease indicate weakness in DOGE and BCH
Dogecoin and Bitcoin Cash registered 3% and 8% losses on Tuesday following increased selling pressure from the futures market. The decline comes amid large-cap cryptos like Bitcoin, Ether and XRP, holding still with slight gains.

XRP could sustain rally amid growing ETF and SEC vote prospects
Ripple flaunted a bullish outlook, trading at $2.1505 on Tuesday. Investor risk appetite has continued to grow since the middle of last week, propping XRP for a sustainable upward move triggered by the swift decision by US President Donald Trump to suspend reciprocal tariffs for 90 days.

VeChain Price Forecast: VET bulls aim for a double-digit rally
VeChain price hovers around $0.023 on Tuesday after breaking above a falling wedge pattern the previous day; a breakout of this pattern favors the bulls. Bybit announced on Monday that VET would be listed on its exchange. Moreover, the technical outlook suggests rallying ahead, targeting double-digit gains.
Dogecoin, Shiba Inu and Fartcoin price prediction if Bitcoin crosses $100K this week
The meme coin market fell sharply on Monday, shedding 4.8% in market capitalization to settle at $49.25 billion, according to data compiled from CoinGecko. The sell-off coincided with increased volatility across broader crypto markets while investors rotated funds into Bitcoin briefly tested $85,000.

Bitcoin Weekly Forecast: Market uncertainty lingers, Trump’s 90-day tariff pause sparks modest recovery
Bitcoin (BTC) price extends recovery to around $82,500 on Friday after dumping to a new year-to-date low of $74,508 to start the week. Market uncertainty remains high, leading to a massive shakeout, with total liquidations hitting $2.18 billion across crypto markets.

The Best brokers to trade EUR/USD
SPONSORED Discover the top brokers for trading EUR/USD in 2025. Our list features brokers with competitive spreads, fast execution, and powerful platforms. Whether you're a beginner or an expert, find the right partner to navigate the dynamic Forex market.