- Shiba Inu price consolidates above the demand zone, extending from $0.0000158 to $0.0000193.
- Transaction data shows that SHIB sits on a massive support level and that a short-term downswing is unlikely.
- The lack of large investors’ footprint indicates that an uptrend will also be capped or lackluster.
Shiba Inu price has sliced through significant support levels during its recent flash crash and is currently consolidating. Going forward, investors can expect SHIB to see a relief rally emerging off the immediate foothold.
Shiba Inu price coils up
Shiba Inu price has been on a non-stop downtrend since its all-time high on October 28, 2021. The downswing has shattered several support levels and is currently testing the 9-hour demand zone, extending from $0.0000158 to $0.0000193.
Investors can expect Shiba Inu price to stay above this foothold and see a breakout from the current consolidation, favoring the bulls. The resulting uptrend is likely to be capped at the 200-day Simple Moving Average (SMA) at $0.0000251.
Although unlikely, this 25% upswing could extend to 38% as it retests the weekly resistance barrier at $0.0000283, roughly coinciding with the 50-day SMA at $0.0000297.
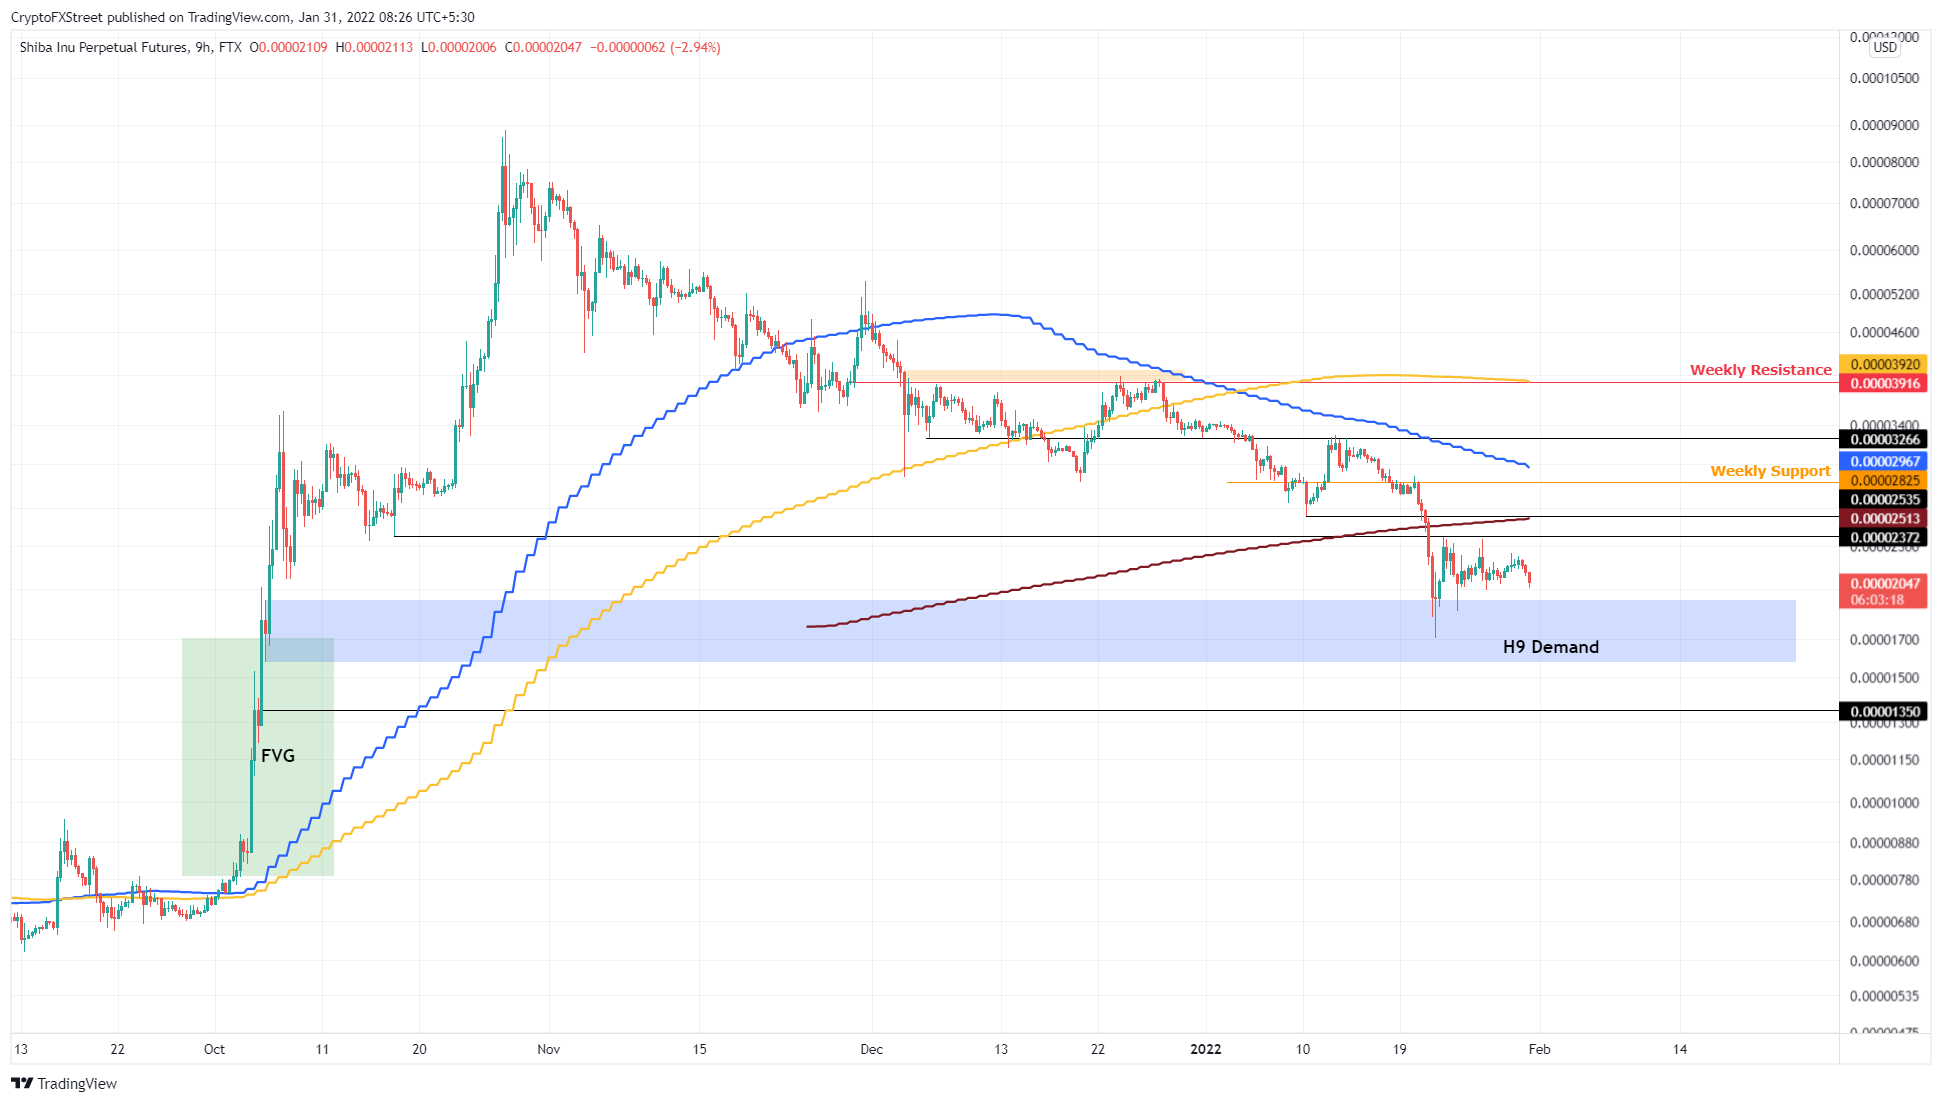
SHIB/USDT 9-hour chart
Supporting a bounce from the said demand zone for Shiba Inu price is IntoTheBlock’s Global In/Out of the Money (GIOM) model. This on-chain index shows that roughly 101,740 addresses that purchased 469,850 billion SHIB tokens at an average price of $0.0000170 are present below.
Therefore, any minor selling pressure will be absorbed by these investors wanting to accumulate more.
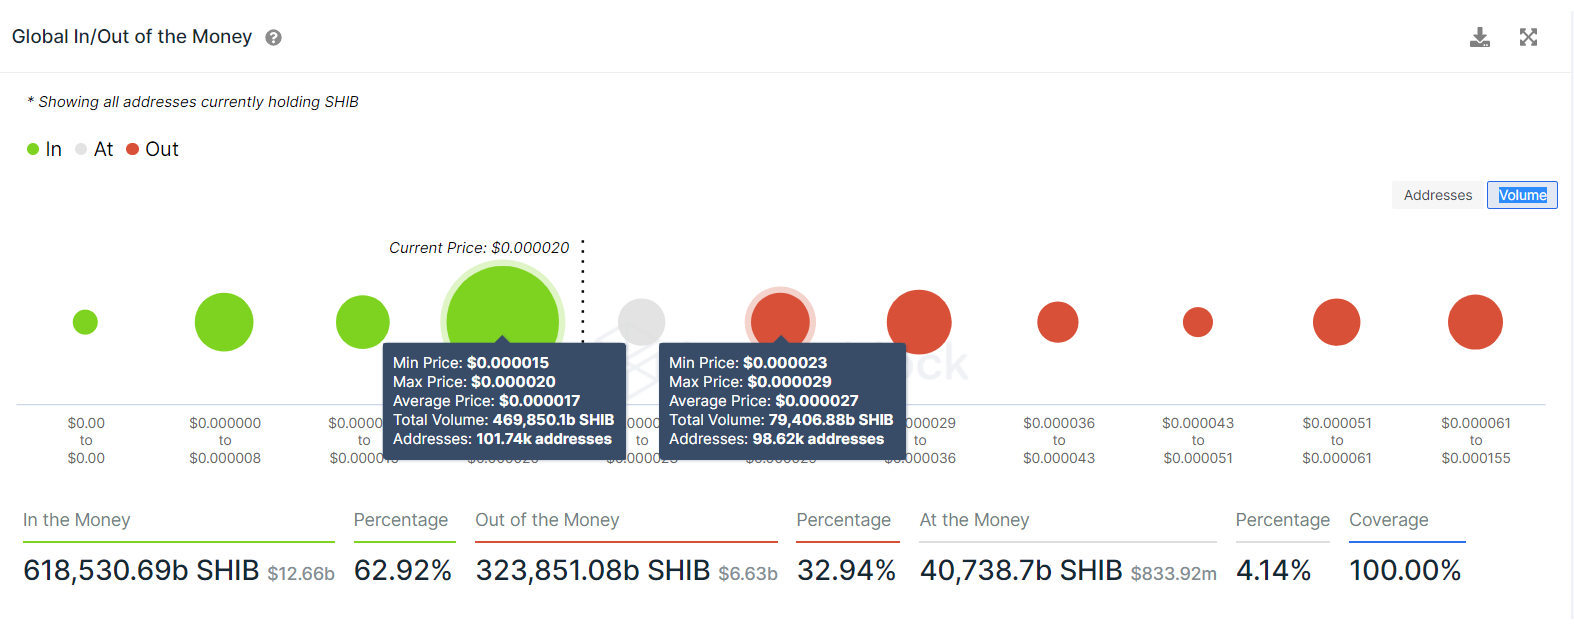
SHIB GIOM
While things are looking up for Shiba Inu price, the number of large transactions worth $100,000 or more seems to be on a downtrend over the past three months. Such transfers have almost halved from 219 to 104, indicating that these investors are not interested in SHIB at the current price levels.
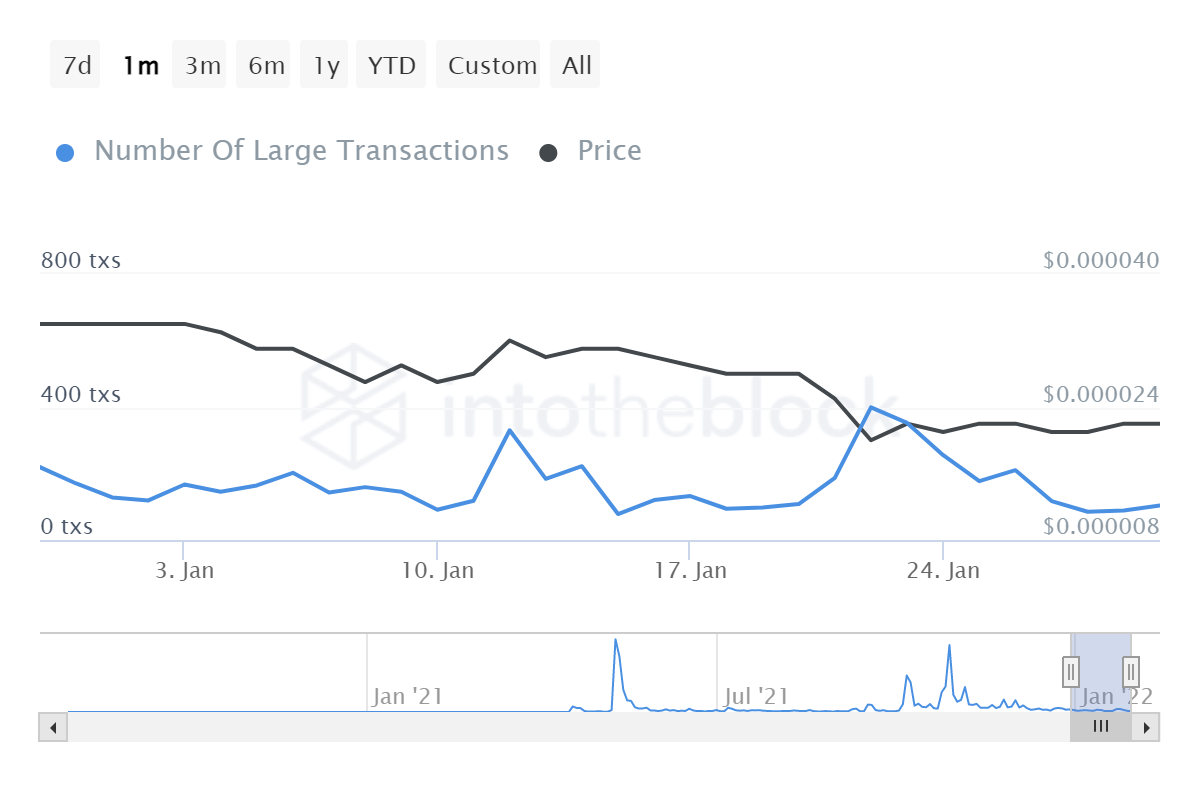
SHIB large transactions
A daily candlestick close below the $0.0000158 to $0.0000193 demand zone will create a lower low and put a large number of holders in this area, “Out of the Money.” If these investors decide to offload their holdings, it will create massive selling pressure, invalidating the bullish thesis for SHIB. This development could see Shiba Inu price fill the fair value gap and retest the eight-decimal support at $0.00000787.
Information on these pages contains forward-looking statements that involve risks and uncertainties. Markets and instruments profiled on this page are for informational purposes only and should not in any way come across as a recommendation to buy or sell in these assets. You should do your own thorough research before making any investment decisions. FXStreet does not in any way guarantee that this information is free from mistakes, errors, or material misstatements. It also does not guarantee that this information is of a timely nature. Investing in Open Markets involves a great deal of risk, including the loss of all or a portion of your investment, as well as emotional distress. All risks, losses and costs associated with investing, including total loss of principal, are your responsibility. The views and opinions expressed in this article are those of the authors and do not necessarily reflect the official policy or position of FXStreet nor its advertisers. The author will not be held responsible for information that is found at the end of links posted on this page.
If not otherwise explicitly mentioned in the body of the article, at the time of writing, the author has no position in any stock mentioned in this article and no business relationship with any company mentioned. The author has not received compensation for writing this article, other than from FXStreet.
FXStreet and the author do not provide personalized recommendations. The author makes no representations as to the accuracy, completeness, or suitability of this information. FXStreet and the author will not be liable for any errors, omissions or any losses, injuries or damages arising from this information and its display or use. Errors and omissions excepted.
The author and FXStreet are not registered investment advisors and nothing in this article is intended to be investment advice.
Recommended Content
Editors’ Picks
Ripple on-chain metrics show bullish signs amidst legal struggle with SEC, XRP eyes recovery
Ripple made a comeback above $0.48 on Tuesday and hovers above that level in Wednesday’s European session. Ripple on-chain metrics such as transaction volume and Network Realized Profit/Loss have turned bullish, supporting a recovery in the altcoin.
Bitcoin price falls amidst German government transfers, miners activity
Bitcoin (BTC) extends correction on Wednesday and hovers around $61,000 after finding resistance near the $64,000 level on Monday. Recent on-chain data indicates heightened selling activity from Bitcoin miners early in the week.
Crypto Today: Bitcoin erases gains from end of June, Ethereum declines while Ripple holds
Bitcoin wipes out gains from the last week of June and falls below $60,000 on Wednesday. Ethereum and top altcoins ranked by market capitalization erased gains as the inflation outlook worsened. Ripple holds on to recent gains and hovers above $0.48 on Wednesday.
Three reasons why altcoins could shake off losses this week
On-chain data from Santiment shows that altcoins are currently in the opportunity zone, or generating buy signals. The top three altcoins in the buy zone are Basic Attention Token (BAT), Chromia (CHR), and Highstreet (HIGH), per Santiment.
Bitcoin: BTC price correction could end in July, according to seasonal data
Bitcoin (BTC) price appears poised for a decline this week, influenced by slight outflows in US spot ETFs, selling activity among BTC miners, and a combined transfer of 4,690.28 BTC to centralized exchanges by the US and German governments.